
Dashboard
Feb 6 2023 at 12:00 AM
- Overview
- Add a chart to an empty dashboard
- Add a chart to a dashboard from the chart configuration page
- Add/delete a chart to the dashboard with the dashboard editing function
- Dashboard options
Overview
BI Navigator’s dashboard is the focus point of the BI Navigator data visualisation experience. Once at least one chart has been created, generated charts can be exported and saved onto the dashboard. The dashboard allows the user to set up filters, cross filters, and tabs to enhance insights gained from the data.
What to expect from this section
The following sections will show how to:
- Create an empty dashboard and add a chart.
- Save and add a chart to a dashboard from the chart’s configuration page.
- Add/delete a saved chart to a dashboard using the dashboard editing function.
Add a chart to an empty dashboard
Clip 1 - Add a chart to a new dashboard
As shown in the clip above:
- From the BI Navigator landing page, click on the
+button (found at the top right of the page) to expand the dropdown. - Select “Dashboard” from the dropdown’s options.
- Once the empty dashboard page has opened, name the new dashboard by replacing [untitled dashboard] with the new dashboard’s name.
- Navigate to the right-hand side of the page. Select a chart (found under the “Charts” tab) and drag it onto the dashboard. In this example the “Internal Ambient Temperature” chart has been dragged onto the empty dashboard.
- Save the dashboard by clicking on the
SAVEbutton found at the top right of the page.
Add a chart to a dashboard from the chart configuration page
To add a chart to a dashboard when saving it, navigate to the chart configuration page:
Clip 2 - Add a saved chart to a dashboard
- Click on
SAVE(found at the top right-hand of the page). - This will open a dialog box. Choose to either overwrite an existing chart’s properties with new properties (by selecting “Save (Overwrite)”) or to save a new chart with “Save As”.
- Give the chart a name.
- Select the “Add to Dashboard” dropdown and choose the dashboard within which the chart should appear (if the dashboard already exists). If a new dashboard needs to be created, specify the dashboard name.
- Click on
SAVEto save the chart.
Add/delete a chart to the dashboard with the dashboard editing function
One can add/delete a chart to a dashboard by selecting the “Edit Dashboard” function on the dashboard page:
Clip 3 - Add/delete a chart using the dashboard editing function
- From the selected dashboard’s page, click on
EDIT DASHBOARD(found at the top right-hand of the page). - This will open the dashboard’s editing page. To add a chart to the dashboard, select the relevant chart (found on the right side of the page under the “Charts” tab) and drag it onto the dashboard.
- Click on
SAVE(found at the top right-hand of the page) to save the dashboard’s new settings. - To delete a chart from the dashboard, navigate to the selected dashboard’s page. Click on
EDIT DASHBOARD. - Once the dashboard’s editing page opens, hover over the top right of the chart you want to delete. This will show a bin icon.
- Click on the bin icon to delete the chart from the dashboard.
- Click on
SAVEto save the dashboard’s new settings.
Dashboard options
Dashboards have certain settings that can be configured according to the user’s preference. These options can be found when clicking on the ellipsis found at the top right of the page on either the dashboard page or the dashboard editing page. The following sections will discuss these options in more detail.
Dashboard options - dashboard page
Click on the ellipsis found at the top right of the dashboard page:
Clip 4 - Dashboard options on the dashboard page
This will expand a dropdown with the following options:
- Refresh dashboard - refresh all dashboard charts (i.e. retrieve all data).
- Enter fullscreen - reload the dashboard without the top Toolbar. Re-select “Exit Fullscreen” to return to the default view.
- Save as - save the dashboard to a different filename.
- Download as image - download an image of the entire dashboard in JPEG format.
- Share:
- Copy permalink to clipboard - copy the file’s link to the user’s local drive.
- Share permalink by email - launch the system’s default email client. This composes a new message featuring the dashboard’s URL.
- Set up an email report - set up an automated email which provides a report of the dashboard’s data.
- Set auto-refresh interval - specify an automatic refresh rate for the dashboard. Options include seconds (10 or 30), minutes (1, 5 or 30) or hours (1, 6, 12, 24). Note this is only applicable for the current session.
Dashboard options - dashboard editing page
Navigate to the selected dashboard and click on EDIT DASHBOARD. Once in the dashboard view mode, click on the ellipsis (at the top right-hand of the page):
Clip 5 - Dashboard options on the dashboard editing page
This will expand a dropdown with the following options:
- Edit properties - activate editing mode. This will open a window with dashboard properties that the user can configure (see more below).
- Edit CSS - load the Live CSS Editor to make ad hoc stylesheet changes in a live editing environment (i.e. changes applied in real time).
- Save as - save the dashboard to a different name.
- Share:
- Copy permalink to clipboard - copy the file’s link to the user’s local drive.
- Share permalink by email - launch the system’s default email client. This composes a new message featuring the dashboard URL.
- Set filter mapping - enable configuration of filter scopes.
- Set auto-refresh interval - specify an automatic refresh rate for the dashboard. Options include seconds (10 or 30), minutes (1, 5 or 30) or hours (1, 6, 12, 24). Note this is only applicable for the current session.
Editing dashboard properties
Click on “Edit properties” in the dropdown described above to open “Dashboard properties”:
Clip 6 - Edit dashboard properties
This window allows the user to configure the following properties:
- Title - edit the title of the dashboard.
- URL Slug - customise the end of the URL (Slug) to a more memorable name.
- Owners - assign/remove access to the dashboard. Click here for more information.
- Roles - contains a list of access constraints imposed on the dashboard. Granting role access to a dashboard will bypass dataset level checks. If no roles are defined, the dashboard will be available to all roles. Click here for more information.
- Colour Scheme - select the colour scheme of the dashboard.
- Certified by - contains the name of the person or group that has certified the dashboard.
- Certification details - any additional certification information can be included here, for example “approved as a proof of concept only”.
- JSON Metadata - click on the
ADVANCEDbutton to open the JSON Metadata panel. This section is for power users who may wish to alter specific advanced dashboard parameters.
Chart options in dashboard view mode
While on the dashboard page (in dashboard view mode), click on the ellipsis found at the top right of the chart:
Clip 7 - Chart options in dashboard view mode
This will expand a dropdown with the following options:
- Force refresh - refresh the chart’s data. The dropdown also shows the time that has passed since the last cache.
- Enter fullscreen - this will open the chart in full screen mode.
- Edit chart - launch the chart in the “Explore” page.
- View query - launch the “View Query” panel, which displays the SQL query used to create the chart. Select the Copy icon to copy the SQL code to your clipboard. See Clip 8 below.
- View as table - this shows the underlying data of the chart in a table. The data can be copied to the clipboard using the Copy icon. See Clip 9 below.
- Share:
- Copy permalink to clipboard - copy a shareable chart link to the system’s clipboard.
- Share chart by email - launch the system’s default email client which composes a new message featuring the chart URL.
- Download:
- Export to .CSV - download the chart’s data in CSV format.
- Download as image - download the chart in the form of an image in JPEG format.
The “View query” option will open an SQL query that can be used to create a chart:
Clip 8 - View query
The “View as table” option shows the underlying data of the chart in a table:
Clip 9 - View as table
Editing the dashboard’s layout
While in dashboard view mode, a user can click on the EDIT DASHBOARD button to edit the layout of the dashboard:
Clip 10 - Dashboard layout options
- Click on
EDIT DASHBOARD(found at the top right of the page in dashboard view mode). - Click on the “Layout Elements” tab. This will open a tab with elements that the user can configure to customise the dashboard’s layout. To use these elements, simply drag and drop the component onto the dashboard.
The following elements can be configured and will be discussed in more detail in the sections below:
- Tabs
- Columns and Rows
- Header
- Markdown
- Divider
Adding dashboard tabs
From the “Layout Elements” tab (EDIT DASHBOARD -> LAYOUT ELEMENTS):
Clip 11 - Adding dashboard tabs
- Click on the Tabs icon.
- Drag the icon onto the top part of the dashboard (drag it close to the “Documentation” heading at the top of the dashboard view).
- An input box will open. Give the tab a title.
- Click on the
+button to add the tab. - Once a new tab has been created, a
+sign will show next to the tab’s title. To add new tabs, click on the+button. You can also click on thexbutton to delete a tab. - To add charts to a tab, navigate to the “Charts” tab found at the right hand of the page. Drag the selected chart onto the dashboard under the preferred tab.
- To ensure the chart is shown under the correct tab, drag the chart onto the tab’s title and then click
SAVE(at the top right of the page).
Inserting a row
While in dashboard view mode, navigate to the “Charts” tab (EDIT DASHBOARD -> CHARTS) found at the right hand of the page:
Clip 12 - Adding dashboard rows
- Select a chart and drag it onto the dashboard. The chart can be resized by dragging its borders to make it bigger or smaller.
- To add a row, navigate to the “Layout Elements” tab at the right of the page. Select the Row option and drag it to the bottom border of the lowest chart on the dashboard. This creates an empty row that can be populated with more charts.
- Select the “Charts” tab and chose a chart with which to populate the empty row.
- Drag and drop the chart onto the empty row.
- Multiple charts can be added to one row. To add a new chart to the same row, drag and drop the chart to the right border of the already existing chart in the row.
- Charts inside rows can also be resized by dragging their borders to make them bigger or smaller.
- Once the dashboard has been configured with rows, click on
SAVE(at the top right of the page).
Inserting a column
While in dashboard view mode, click on EDIT DASHBOARD (found at the top right of the page) to open the dashboard editing options:
Clip 13 - Adding dashboard columns
- Navigate to the “Charts” tab and drag and drop a chart onto the dashboard.
- Click on “Layout Elements” and select the Column icon.
- Drag the Column icon and drop it where you would like to create a column on the dashboard. If the column should be next to the existing chart on the dashboard, drag the Column icon to the right border of the existing chart until the border highlights, then drop the column.
- Populate the empty column with selected charts. Resize the charts to customise the dashboard view.
- The column can be deleted (or settings can be configured) by clicking on icons that show up at the top center when the user is hovering over the column.
- Once the column layout has been configured, click on
SAVE(at the top right of the page).
Adding a header
While in dashboard view mode, click on EDIT DASHBOARD (found at the top right of the page) to open the dashboard editing options:
Clip 14 - Adding a header
- Navigate to the “Layout Elements” tab and drag and drop the Header icon onto the top of the dashboard.
- Place the cursor in the input box that says “New header” and replace the text with the name of the dashboard.
Writing in markdown
This icon allows the user to write in markdown.
While in dashboard view mode, click on EDIT DASHBOARD (found at the top right of the page) to open the dashboard editing options:
Clip 15 - Add a markdown block
- Navigate to the “Layout Elements” tab and drag and drop the Markdown icon onto the dashboard.
- Click on the “Click here to edit markdown” link.
- This will open the markdown editing block. To toggle between the markdown text editor and markdown preview mode, click on the “Edit” dropdown found at the top right of the block. Click on
Editto write in markdown or onPreviewto see the preview of your edits.
Adding a divider
Users can create a divider between charts on the dashboard.
While in dashboard view mode, click on EDIT DASHBOARD (found at the top right of the page) to open the dashboard editing options:
Clip 16 - Add a divider
Navigate to the “Layout Elements” tab and drag and drop the Divider icon to the position on the dashboard where you would like to divide the charts.
Dashboard filtering
Navigator’s dashboard filters offer powerful data filtering functionality coupled with an intuitive interface. All dashboards have a “Filters” sidebar that can be expanded so that the user can easily apply a variety of filters to all charts linked to that dashboard.
Value filter types enable the user to specify any value for any column within the dataset. This provides considerable freedom in terms of filtering options. Numerical range filters offer a simple way to define a numeric value range within categories such as pricing data or years. Additionally, Navigator offers several time-based filters (i.e., Time Range, Time Column and Time Grain) that enable the user to filter all charts using a selected dataset’s time column.
Both basic and advanced configuration settings empower the user to expand on filtering capability, enhancing filtration options and usability.
Accessing the filter configuration window
All dashboards have a “Filters” sidebar that can be expanded. To access the filter configuration window, go to the selected dashboard (in dashboard view):
Clip 17 - Accessing Filter configuration options
- Click on the right-arrow expand button.
- Once the “Filters” sidebar has opened, click on
+ ADD/EDIT FILTERS.
The “Add and edit filters” window will open, providing a variety of filter configuration options:
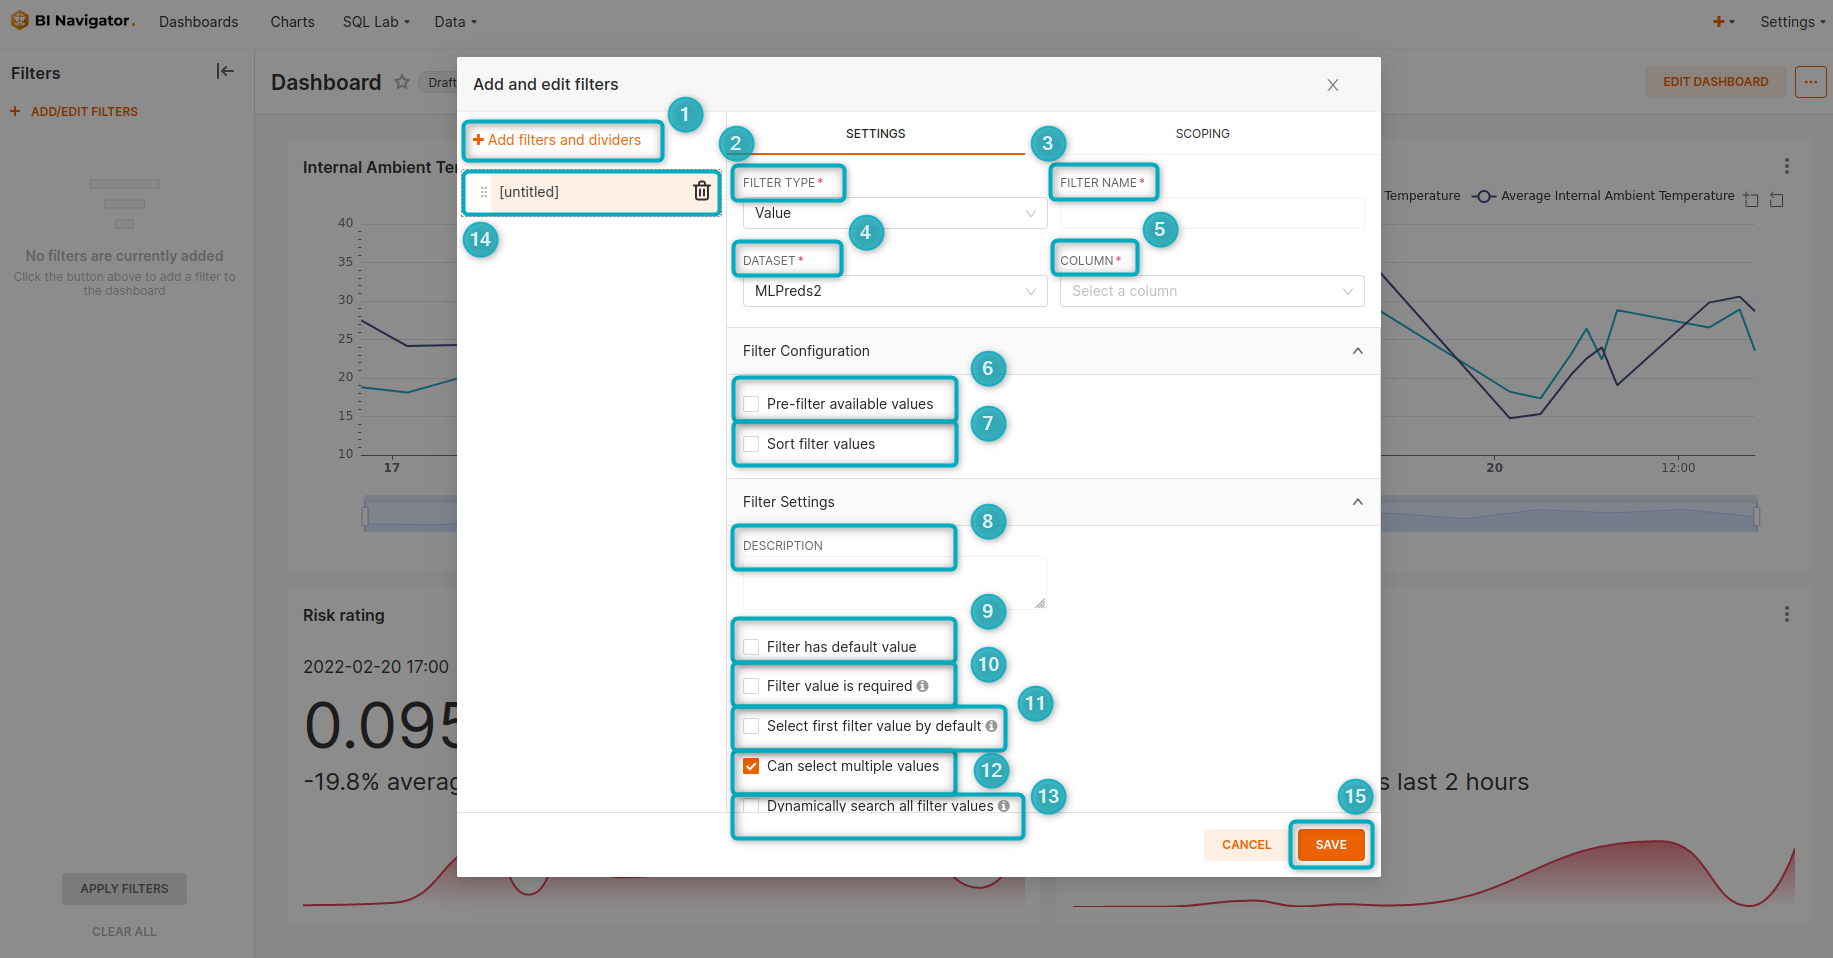
Figure 1 - Add and edit filters window
- Add filters and dividers - a divider in the filter window allows the user to split the filters and write a comment for each filter group. Click on the
+icon next toADD/EDIT FILTERSon the left of the page to open the window. See Clip 18 below. - Filter type - select a filter type. Options include Value, Numerical range, Time range, Time column, and Time grain.
- Filter name - provide a descriptive name for the new filter. The name should generally correlate with the selection made in the “Column” field.
- Dataset - select the dataset that should be applied to the charts in the dashboard. By default the user will be able to select all datasets associated with the dashboard’s charts. This field appears when any one of the Value, Numerical range, Time column or Time grain filter types are selected.
- Column - select a column to which the filter should be applied. This field appears when either the Value or Numerical range field types are selected.
- Pre-filter available values - select this option to implement an additional layer of filtering. The filters added here will act on the underlying data before any user-selected filter options are set.
- Sort filter values - this option allows the user to control how filter options will be sorted in the dropdown. Filter options can be sorted in ascending or descending order.
- Filter Settings - this provides additional control over the behaviour of selected filters.
- Filter has default value - provide a default filter value. For example, a user can set the dashboard to filter to a particular time range or geographical region by default.
- Filter value is required - this setting requires the user to select a value before applying the filter (the filter cannot be left blank). A default filter has to be selected before this setting can be configured.
- Select first filter value by default - select this setting if the first filter value in the list should be used. When using this option the default value setting cannot be used.
- Can select multiple values - this setting allows the user to select multiple values to which the filter can be applied. If this is not enabled the user will only be able to select a single value to which the filter can be applied.
- Dynamically search all filter values - by default each filter loads at most 1000 choices at the initial page load. Check this box if there are more than 1000 filter options/values and the user wants to enable dynamic searching that loads filter values while the user types.
- Title placeholder - the title of the filter (provided under “Filter name”) will appear here. You can also click on the bin icon to remove a filter.
- Save - Once all relevant filter settings have been configured, click on the
SAVEbutton to save the filter.
| Applying “Dynamically search all filter types” may add stress to the database. |
Additional filter configuration options:
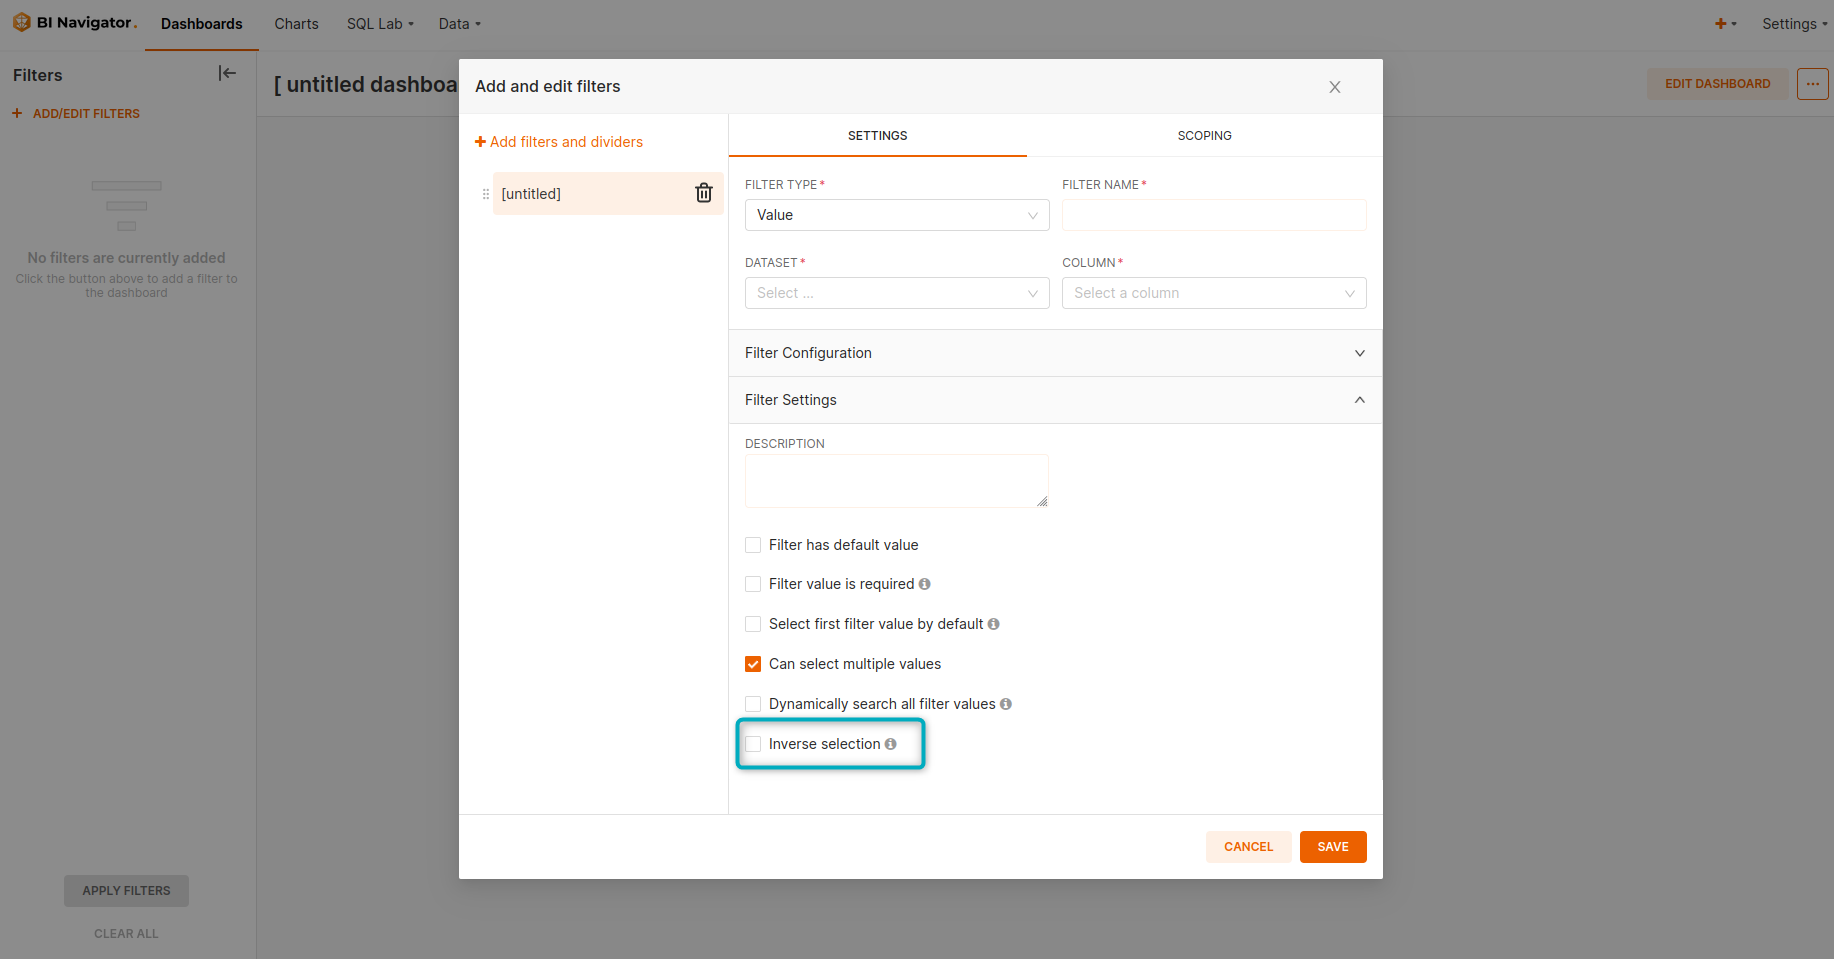
Figure 2 - Inverse selection
Scroll down the options under “Filter Settings” to see the “Inverse selection” option. Clicking on this option will exclude selected values.
To add a filter divider:
Clip 18 - Add a filter divider
- Click on the
+icon next toADD/EDIT FILTERSon the left of the page to open the “Add and edit filters” window. - Click on the
+icon (at the top left of the window) next to “Add filters and dividers”. - In the dropdown that opens, click on “Divider”.
- In the input boxes provided, add a title and description of the divider.
- You can change the order of the divider list on the left by selecting and dragging dividers to the preferred position.
- Once all dividers have been configured, click on
SAVE.
The sections below will discuss the following configuration elements in more detail:
- Value filter type
- Numerical range filter type
- Time range filter type
- Time column filter type
- Time grain filter type
- Scoping filters
Value filter type
To create a Value filter type:
Expand the “Filters” sidebar on the right and click on + ADD/EDIT FILTERS:
Clip 19 - Create a value filter
- Provide a filter name in the “Filter name” input box.
- Select a platform from the dropdown under “Column”.
- Select Value from the dropdown under “Filter type”.
- Click on the
SAVEbutton.
To apply the newly created value filter:
While still on the dashboard’s page (in dashboard view), expand the “Filters” sidebar. The newly created filter will be listed in the sidebar with a dropdown that contains all the filtering options related to that filter:
Clip 20 - Apply a value filter
- Click on the filter options that need to be applied to the charts on the dashboard. They will be added to the input box under the filter’s name.
- Click on
APPLY FILTERS. This will apply the selected filters to all the charts in the dashboard (on the right).
Numerical range filter type
This filter type creates a range slider that enables the user to specify a range’s upper and lower limits.
To create a numerical range filter:
Clip 21 - Create a numerical range filter
While on the dashboard page (in dashboard view mode), expand the “Filters” sidebar on the left and click on + ADD/EDIT FILTERS:
- When the “Add and edit filters” window opens, choose Numerical range from the dropdown under “Filter type” and name the filter under “Filter name”.
- Choose the type of data to be applied from the dropdown under “Column” (in this case it is Ambient Internal Temperature).
- Click on the
SAVEbutton.
To apply a numerical range filter:
While on the dashboard page (in dashboard view mode), expand the “Filters” sidebar on the left:
Clip 22 - Apply a numerical range filter
- The expanded sidebar will include the newly created numerical range filter, represented as a slider.
- Slide the left and right side of the slider to set the range’s upper and lower limits.
- Click on
APPLY FILTERSto apply the range limits to the charts in the dashboard (on the right).
| The user can view the upper and lower limits of the range by hovering on the leftmost/rightmost anchor points on the slider. |
Time range filter type
This filter type launches Navigator’s Edit Time Range functionality.
To create a time range filter:
While on the dashboard page (in dashboard view mode), expand the “Filters” sidebar and click on + ADD/EDIT FILTERS:
Clip 23 - Create a time range filter
- Under the “Filter type” dropdown, select Time range.
- Name the filter. Best practice is to make the name correlate with the “Filter type”.
- Click on the
SAVEbutton to save the filter. - The filter can now be seen in the “Filters” sidebar on the left of the page.
To apply the time range filter:
While on the dashboard page (in dashboard view mode):
Clip 24 - Apply a time range filter
- Expand the “Filters” sidebar on the left side of the page.
- Click on the
No filterbutton under the newly created filter’s title to edit the time range. - In the “Edit” window that opens, select the range type from the dropdown. Options include “Last”, “Previous”, “Custom” and “Advanced”.
- Depending on which option is chosen, new configuration options will appear. For example, if “Last” is chosen as the range type, the new configurations will include options like “Last day”, “Last week”, and so on. Select the relevant option.
- Click on the
APPLYbutton to apply the new time range settings. - Once the window has closed, the button under the filter’s title will represent the settings that were configured in the “Edit” window.
- Click on
APPLY FILTERSto apply the filter to all the charts in the dashboard on the right.
| The Time Range filter configuration is identical to the Time Range configuration when creating a new chart. |
Time column filter type
This filter type creates a dropdown menu that enables the user to select a new dashboard-level time column that will overwrite any existing time columns defined at the chart level.
To create a time column filter:
While on the dashboard’s page (in dashboard view mode), expand the “Filters” sidebar on the left of the page:
Clip 25 - Create a time column filter
- Click on
+ ADD/EDIT FILTERSto open the “Add and edit filters” window. - Select Time column from the dropdown under “Filter type”.
- Name your filter. Best practice is to make the name correlate with the “Filter type”.
- Click on the
SAVEbutton to save the filter.
To apply a time column filter:
While on the dashboard page (in dashboard view mode), expand the “Filters” sidebar to see the newly created time column filter:
Clip 26 - Apply a time column filter
- Open the dropdown found under the newly created filter’s title. This dropdown contains a list of available time columns that can be selected to overwrite existing time columns defined at the chart level.
- Select the relevant time column from the list.
- Click on the
APPLY FILTERSbutton to apply the filter to the dashboard’s charts on the right side of the page. The charts will refresh and display the new applied filter.
Time grain filter type
This filter type creates a dropdown that enables the user to select a time granularity. When applied, all timestamps are grouped based on the selected time grain.
To create a time grain filter:
While on the dashboard page (in dashboard view mode), expand the “Filters” sidebar and click on + ADD/EDIT FILTERS:
Clip 27 - Create a time grain filter
- In the “Add and edit filters” window, select Time grain from the dropdown options under “Filter type”.
- Name your filter. Best practice is to make the name correlate with the “Filter type”.
- Click on the
SAVEbutton to save the filter.
To apply a time grain filter:
Navigate back to the dashboard page (in dashboard view mode). Expand the “Filters” sidebar on the left:
Clip 28 - Apply a time grain filter
- The newly created filter will be listed in the expanded “Filters” sidebar on the left side of the page. Open the dropdown to select a time grain option for the filter. Options include “Second”, “Minute”, “Hour”, “Day”, and so on.
- Select the relevant time grain option and click on
APPLY FILTERSto apply the chosen time grain filter configuration. - The charts on the right of the page will refresh and display the new applied filter.
Scoping filters
Users can configure filters on a dashboard to be scoped (limited) to specific charts, tables, and tabs.
To use scoping filters:
While on the dashboard page (in dashboard view mode), expand the “Filters” sidebar and click on + ADD/EDIT FILTERS:
Clip 29 - Using scoping filters
- Once the “Add and edit filters” window has opened, select the filter you want to configure and navigate to the “Scoping” tab (found at the top right).
- Select “Apply to all panels” or “Apply to specific panels”. This will depend on the application’s requirements. To limit the filter’s scope, select “Apply to specific panels” and select the panels to which the filter should apply.