
Trendline Widget
Feb 1 2023 at 12:00 AM
Description
The Trendline widget allows the user to create a visual representation of support and resistance in any time frame.
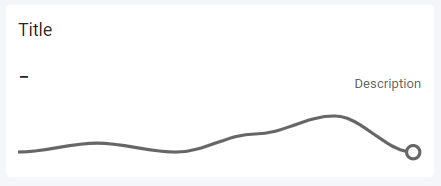
Figure 1 - Trendline widget
Properties
Value
Value: The description to be displayed on the widget.
<%=VALUE%>: Current value of endpoint<%=VALUE | TIMESTAMP%>: Date and time of last update<%=VALUE | ELAPSED%>: Time since last update- You can also add any string value directly into the textbox, this will display your text as is.
Type: The type of the description which determine the default value for the size of the text.
- Heading: Size is set to 16.
- Sub-heading: Size is set to 14.
- Body: Size is set to 12.
- Custom: User can specify the size of the title.
Size: Specify the size of the title, if the default size is changed the Type will change to Custom.
Format: Can change the format of the title to Superscript or Subscript.
Align: Align the title left, centre or to the right of the widget.
V-Align: Vertical alignment of the tile, options available are top, middle and bottom.
Description
Value: The description to be displayed on the widget.
Type : The type of the description which determines the default value for the size of the text.
- Heading: Size is set to 16.
- Sub-heading: Size is set to 14.
- Body: Size is set to 12.
- Custom: User can specify the size of the tile.
Size: Specify the size of the title, if the default size is changed then the Type property value will change to Custom.
Format: Can change the format of the title to Superscript or Subscript.
Align: Align the title left, centre or to the right of the widget.
V-Align: Vertical alignment of the tile, options available are top, middle, bottom.
Trendline
Data range: This determines the number of endpoint values. There is a minimum of 0 endpoint values and a maximum of 200 endpoint values.
Colour: Select the icon colour from the colour pallette.
Enable Threshold: This provides context to the magnitude set.
Use Case
A site manager uses a trendline widget to measure and evaluate the amount of rain annually that the particular site is receiving, values are entered into the trendline to visualise the rainfall per month.
Below is an example of that:
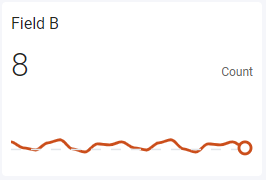
Figure 2 - Trendline widget example