
Gauge Widget
Feb 1 2023 at 12:00 AM
Description
The Gauge widget allows the user to display data linked to an endpoint with minimum and maximum values. You can specify the unit of measurement and format the gauge colour.
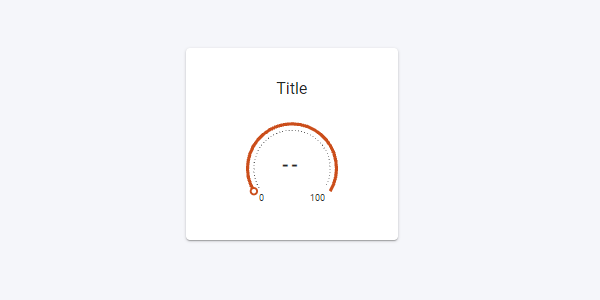
Figure 1 - Gauge Widget
Properties
Unit: Set the measurement unit that represents the endpoint data.
Range: Set the minimum and maximum values that the gauge will display.
Format: Select the gauge colour from the colour pallet.
Use Case
In most cases, a gauge widget is used when a pre determined range is given. A typical case is when you have a range from 0 to 100 percent (%). Examples of where a value would need to be defined using a gauge are soil moisture, humidity, temperature, fuel levels, etc.
Below is an example of a gauge measuring a vehicle’s transmission oil temperature.
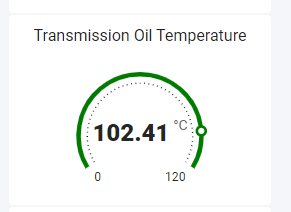
Figure 2 - Gauge example