
Raptor Status Application
Jan 1 2022 at 12:00 AM
This article provides a walk-through of a detailed device and Raptor monitoring application within the Virtual Raptor that is referred to as Sonar. This application can be found on a Raptor specific landing page.
Monitoring
Monitoring on a per level basis of the wholistic system will indicate potential failures within the system easily and quickly, which allows for end users to be proactive in detecting issues before they happen rather than responding reactively. The device management platform\application will primarily handle visualizations of the different interacting services, gateways, devices, etc. The visualizations will contain a RAG status graph.
The RAG status graph will visually indicate whether a service\driver\device is healthy, having minor issues or has failed completely. This will, in turn, allow for investigation time to be reduced as it will indicate which level is having an issue. As per the architectural flow diagram – at the top level is the main Raptor service. This service always needs to be stable and should not be restarted or interfered with unless absolutely necessary, therefore the visualisations indicating lower-level drill downs will depict issues where services are not functioning as expected and will require investigation and potentially a service restart. A secondary telemetry pipeline will be utilized as a layer in conjunction to the rest – this layer will aggregate information and make the final determining decisions of the RAG status of a gateway (Micro Raptor, Virtual Raptor, Edge Raptor, Teltonika, etc.)
Once services on the different levels start showing issues – visual alarms will be raised via the device manager applications.
There will be a focus on bandwidth reduction, so this overall monitoring solution/application does not hinder the system on which it is being implemented and hosted, as well as to not increase data usage costs for multiple devices linked to multiple raptors with many endpoint properties reporting. To reduce bandwidth usage and consumption – the Raptor and device monitoring application will report on properties and data points that have changed (deltas).
Raptor
As per ’figure 1’ - the raptor is the top level within the environment, and it is therefore important to closely monitor the performance and health of it. To do this, internal aspects will need to be monitored and reported on to continuously be able to accurately report. This will be done by utilising Pseudo Endpoints\properties on the secondary telemetry pipeline discussed above.
These Pseudo Endpoints will be used within device manager monitoring for visualisation and alarming:
- Raptor Health\Status
- Overall check of the Raptor performance and health
- Internet Connection vs. queue connection
- Heartbeat
- Disc Space
- Overall check of the Raptor performance and health
- Internet Connection
- Check Raptor connection to cloud (On or Off Premises)
- Queue Connection
- Connection to Rabbit queue\Gateway 2 – Raptor telemetry data being sent & Received
- Uptime
- Total time (with date, time stamp) of Raptor being online
- Heartbeat
- Count of messages\any data regarding Raptor
- Disc Space
- Check available Raptor resources vs. benchmark (Ram usage, Cache capacity, Processing Availability, General Storage)
- Time Stamps (messages in vs out)
- Messages received from device(s) versus messages sending from Raptor to queue
- Message Queue build up
- Time Stamps to assist in identifying message queue build up. Warning system for potential tenant backlog
- Data Usage
- Track quantity of data (Eg. Megabytes, Gigabytes) being sent into Raptor per driver
- Where is the data sent to Vraptor and Commander being stored?
- Device Connection
- Device is detected on Raptor (Eg. there are 6 out of the expected 8 devices reporting on Raptor)
- Endpoint Communication (from Edge Raptor or direct)
- Total number of properties expected by the raptor (usual quantity) versus current number of properties being received by the raptor
Raptor Status Dashboard
A dashboard will be available for end users to view the overall health of a V-Raptor. The dashboard will show the health status of the services within the Raptor with visual tags. Users will be able to views ‘All services’, ‘Healthy services’, ‘Degraded services’, ‘Unhealthy services’ and ‘Not found services’:
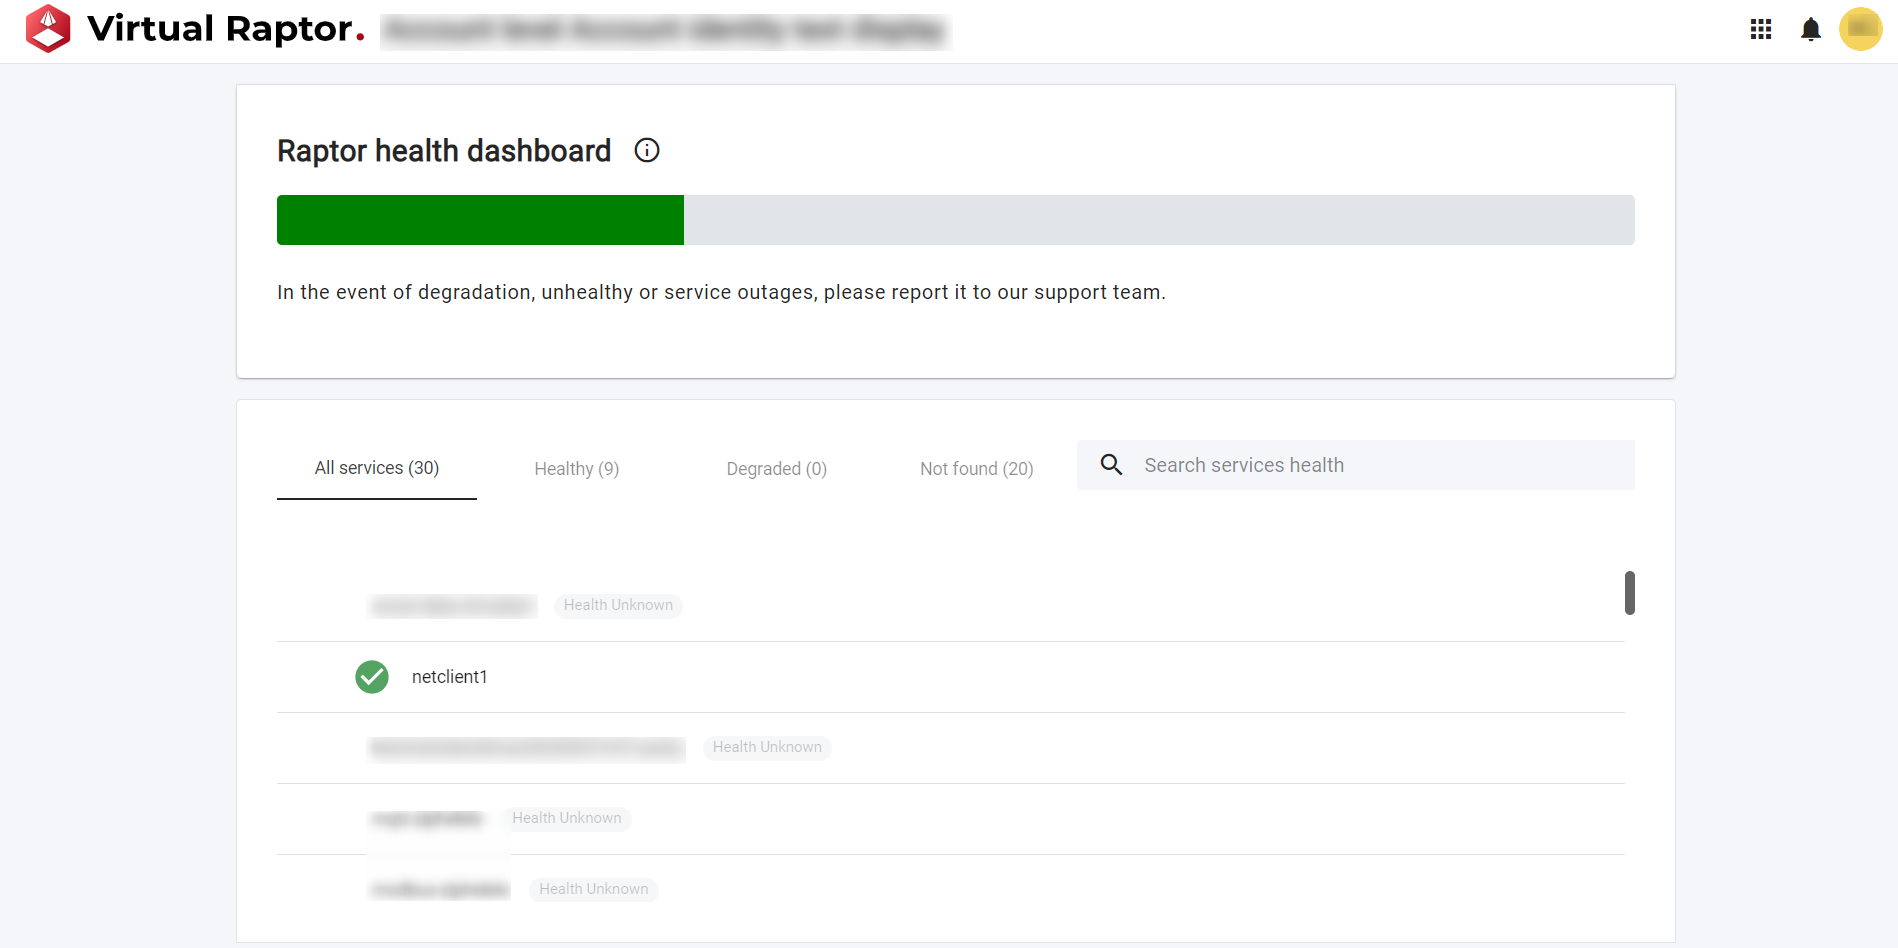
Figure 1 – Overview of Raptor health (‘All services’)
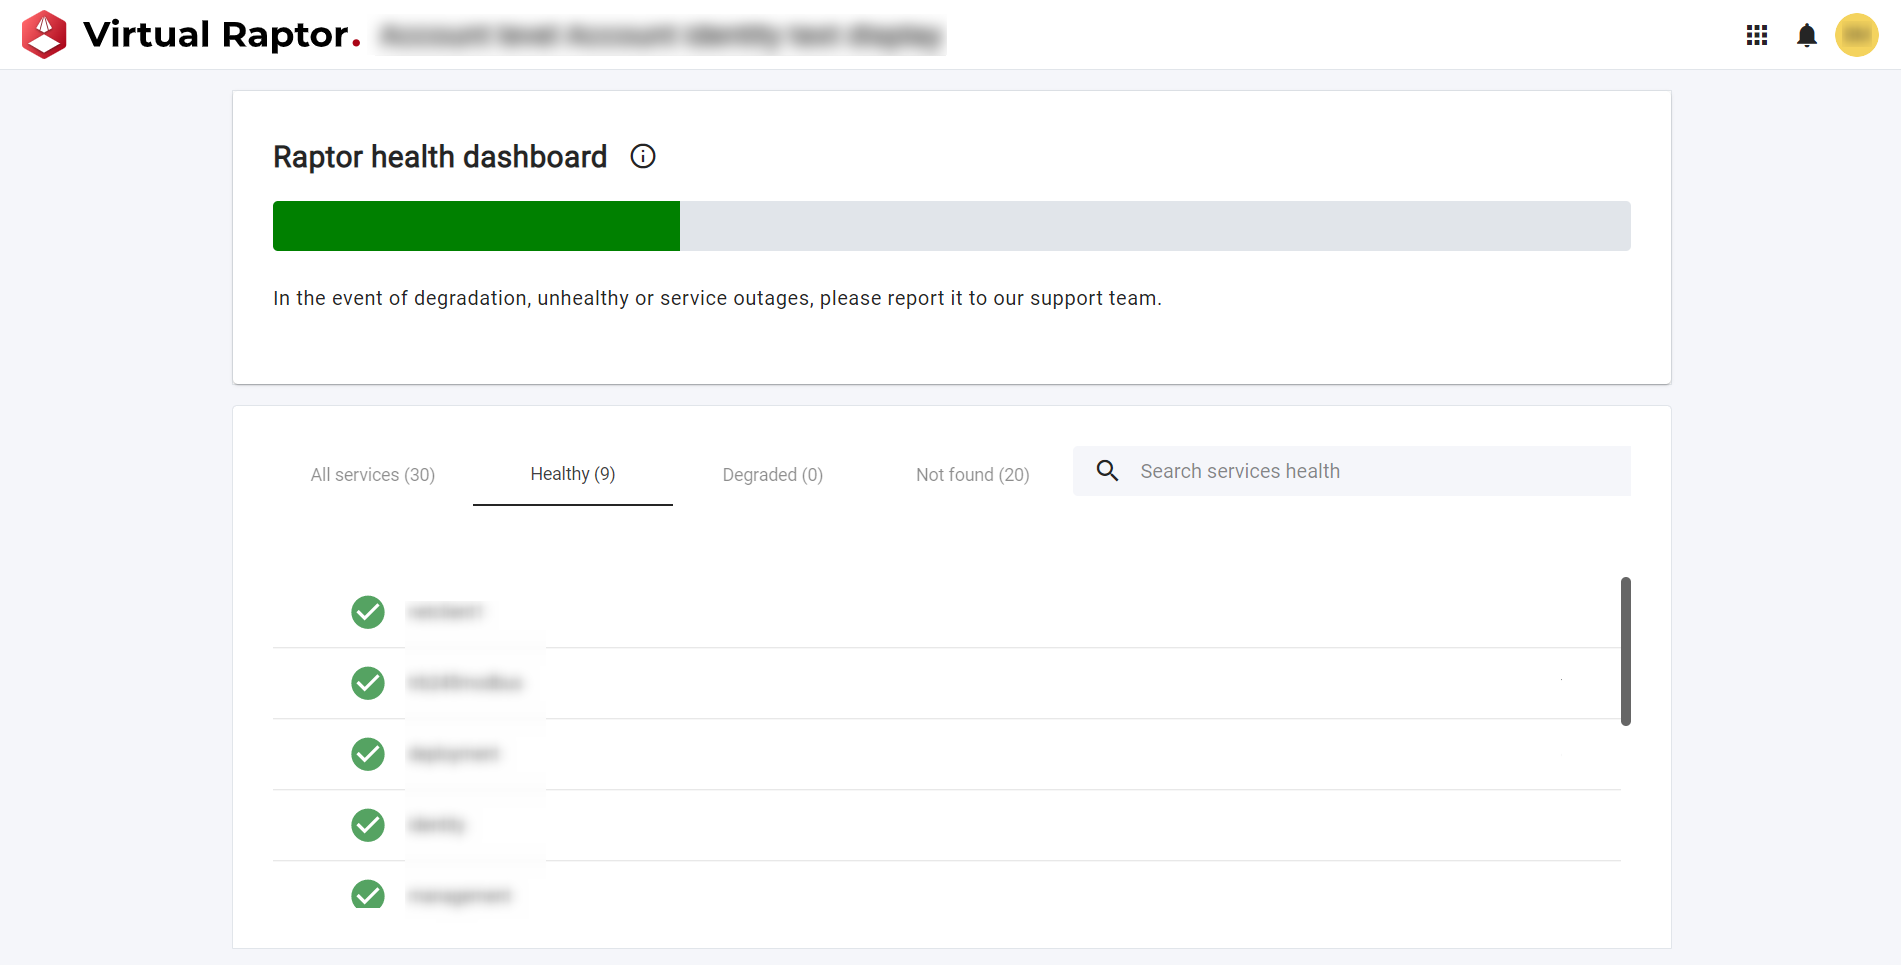
Figure 2 – Overview of Raptor health (‘Healthy services’)
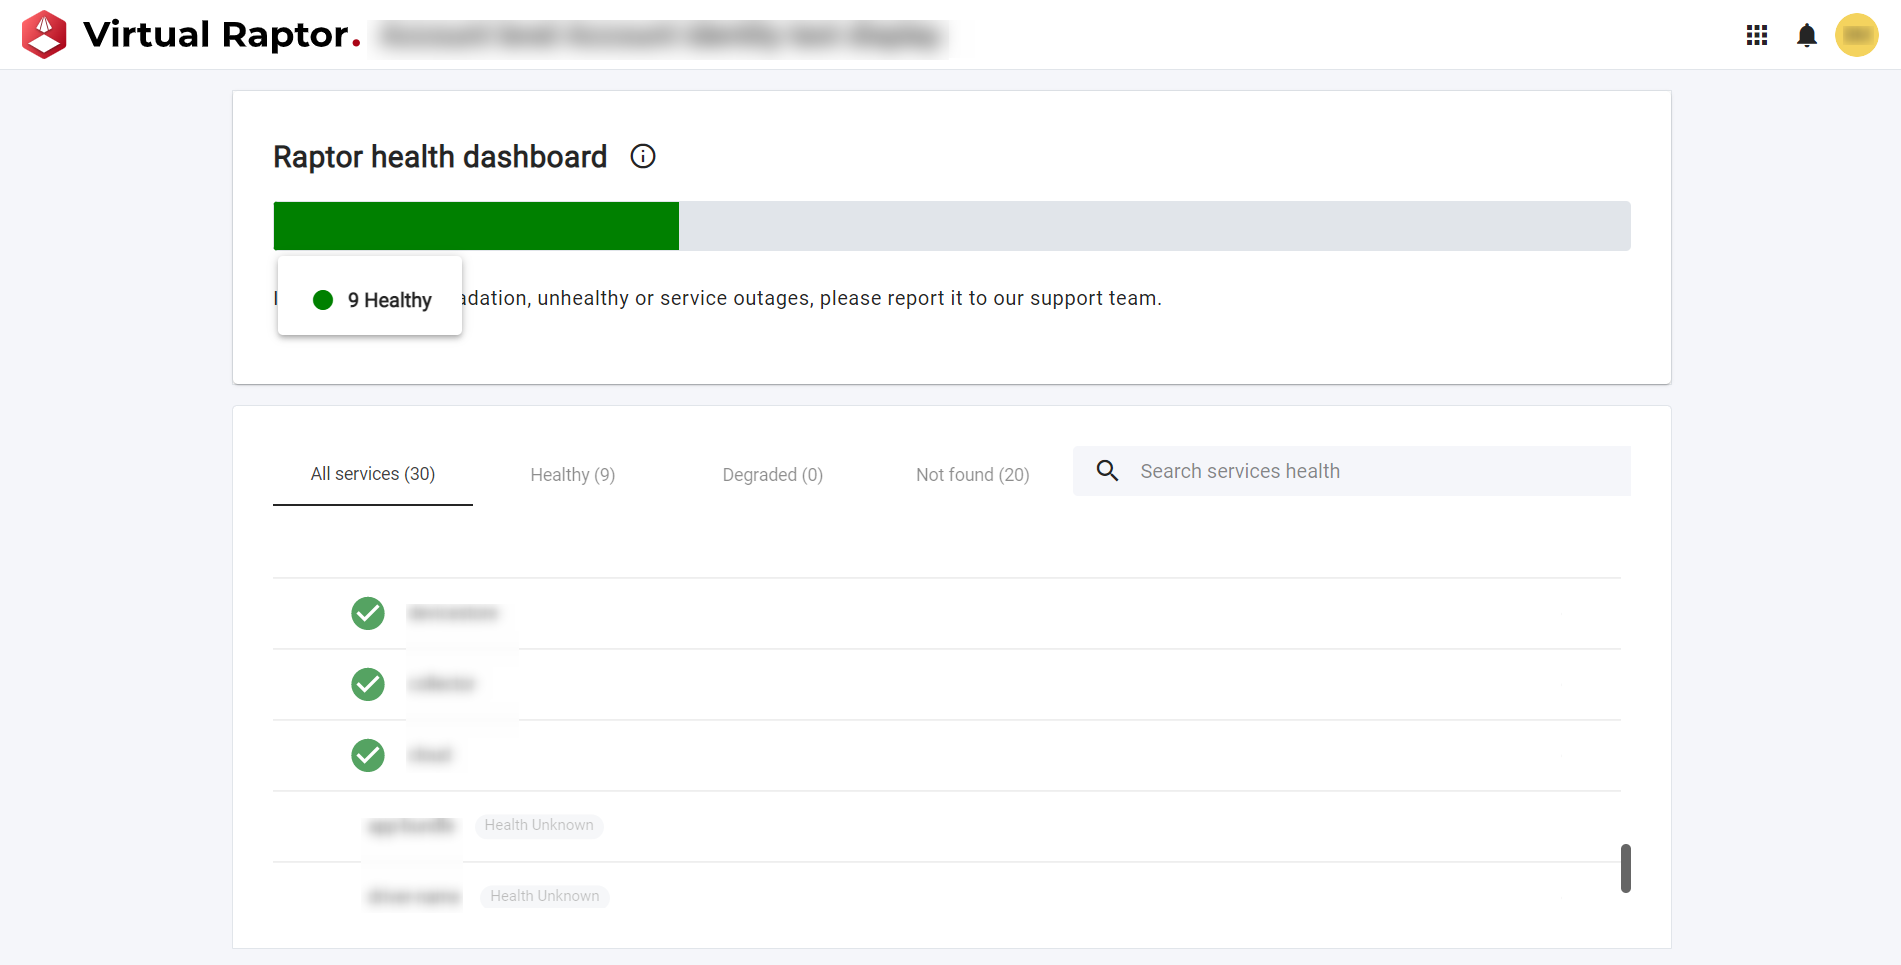
Figure 3 – Healthy services
A Raptor contains a gateway, whereby all devices and device properties can be found. This gateway health needs to be monitored, as if it is not functioning as expected then the devices data will not flow through the relevant layers and eventually report the desired data.