
Use Case
Jul 27 2023 at 12:00 AM
Overview
The following article uses Smart Metering devices as a use case to showcase Navigator’s features. Navigator can overlay data from devices on a map to display the meter status and location information, as well as display the data in tabular form and provide filtering capability to show specific meters or groups (i.e. towns or regions). The platform also provides navigation functionality to each individual site.
Monthly reports can also be generated, with easy-to-read consumption data based on the telemetry ingested from the edge. Data can be presented in kWh, kVA, kVArh, power factor, current and voltage formats. This allows the client to see a holistic view across all facilities regarding both consumption trends and power quality.
In addition to providing monthly reports across all relevant facilities which detail demand, energy, reactive, fixed costs, and power factor, billing engine integration facilitates an analysis of billing data and the generation of reports to query incorrect billing with utilities providers.
Finally, data analytic capabilities and filterable reports enable configuration of facility comparison (whether using the number of employee/kWh, employee/kVA, kWh/m2/a, bed/kWh, bed/kVA etc) aligned with the Energy Performance Certificates for buildings. These can be submitted for auditing purposes to the relevant certified EPC (Energy Performance Certificate) inspection body.
Reporting and Analytics Examples
The examples below show:
- Monthly reports
- Historical reporting
- Energy Performance Certificates
Monthly Reports
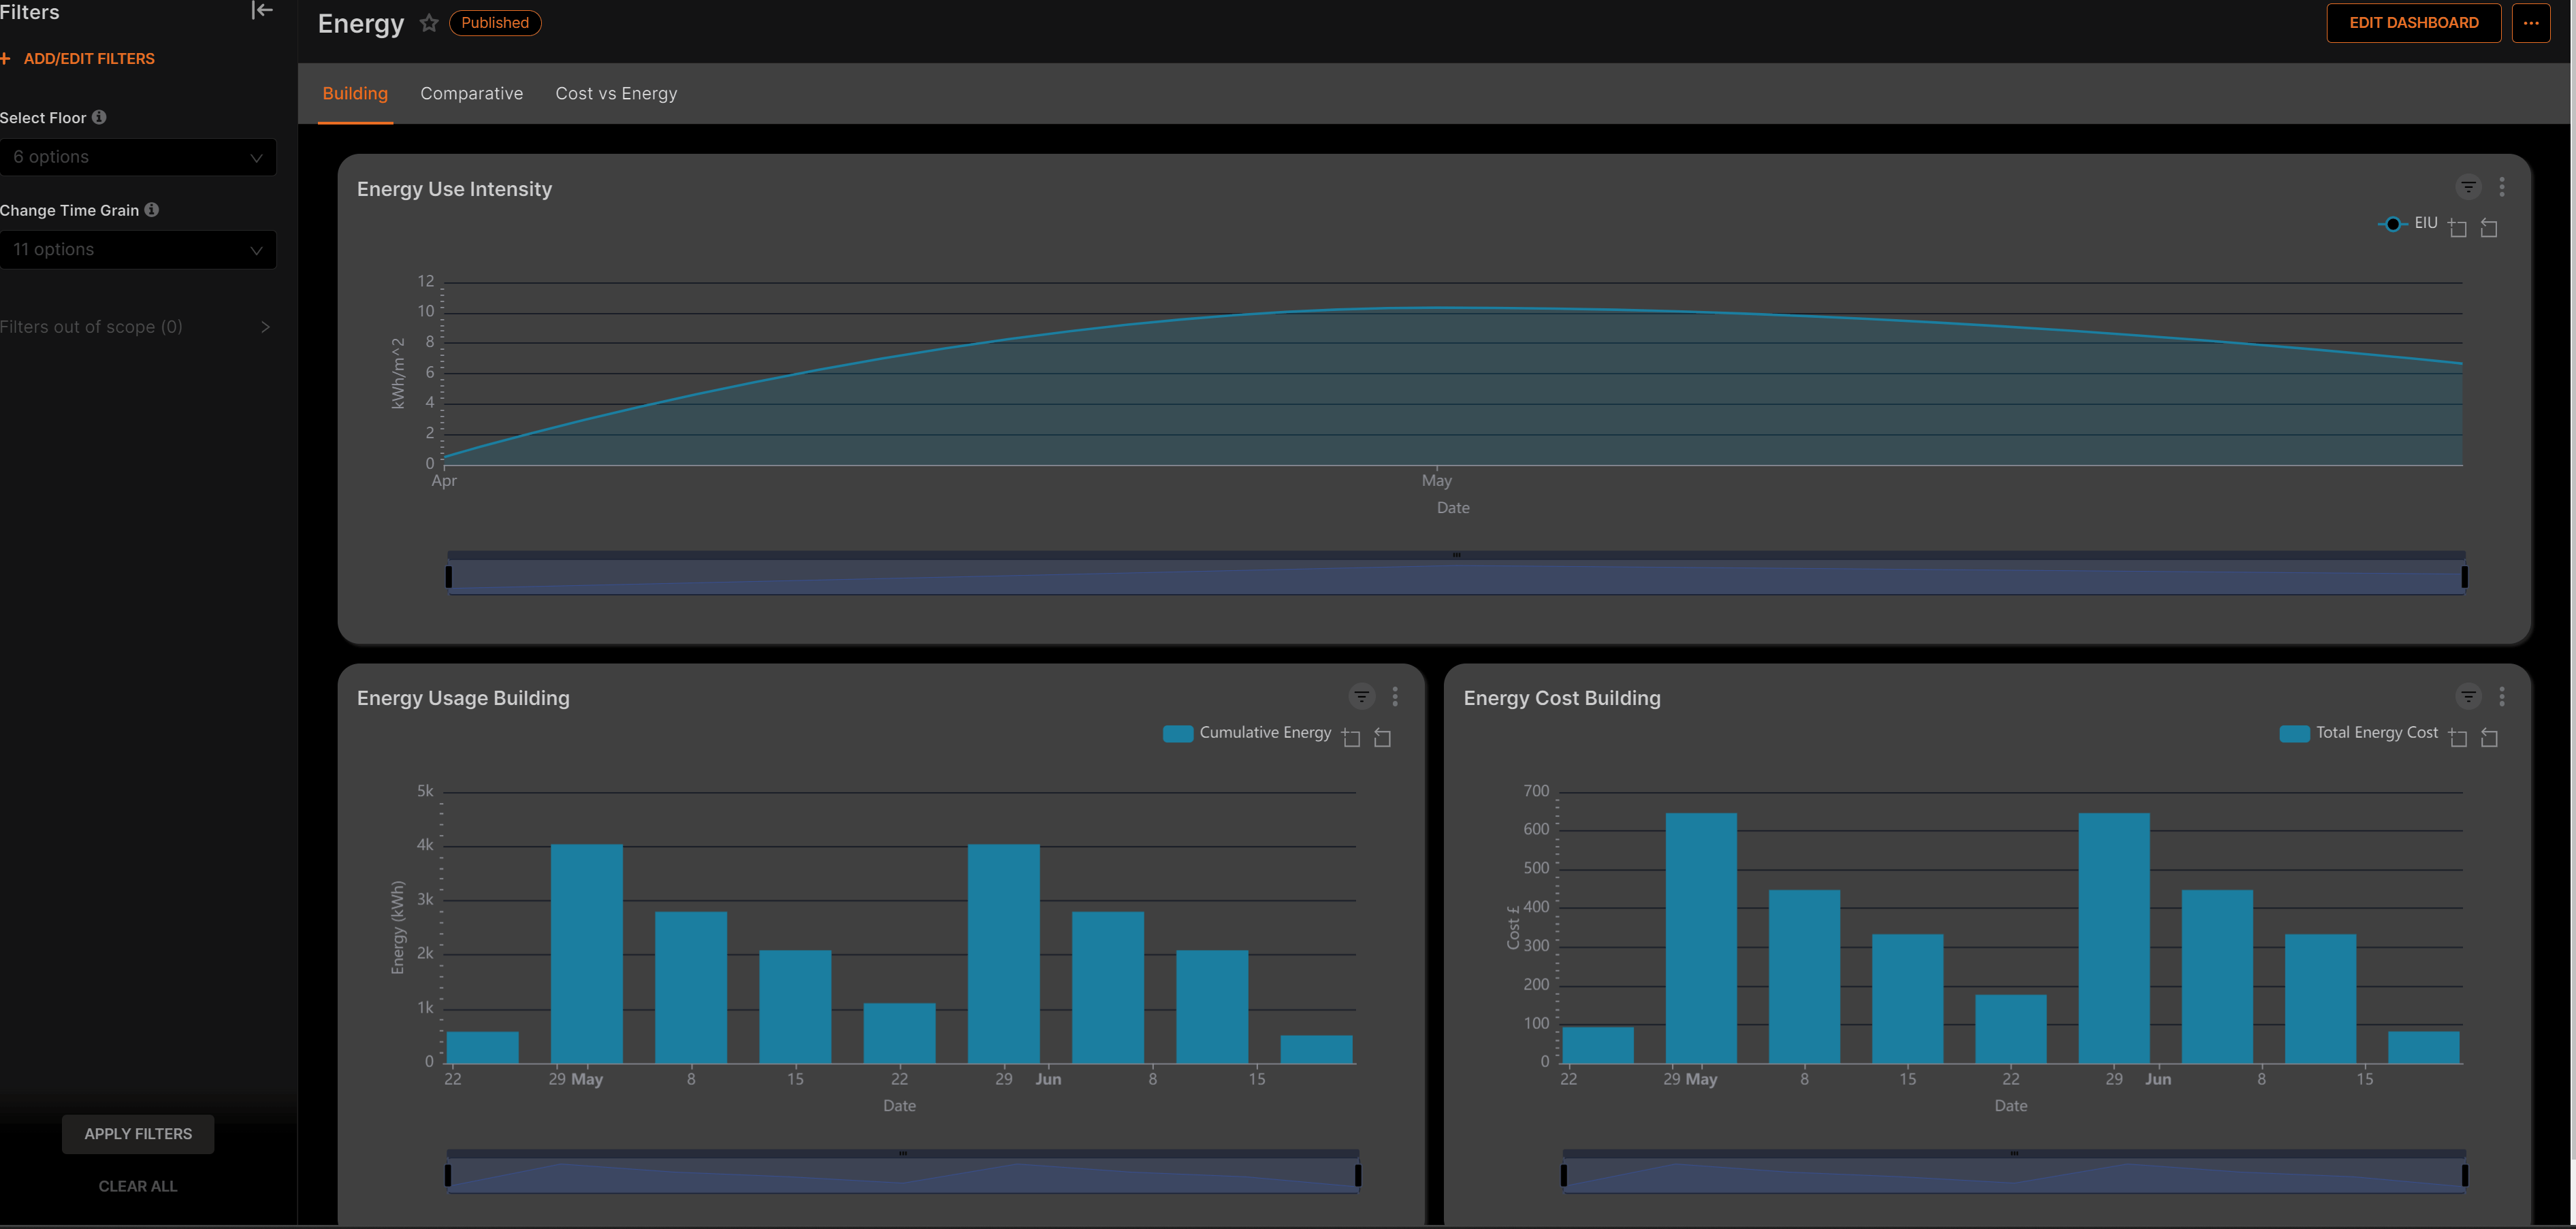
The platform can be configured to provide monthly reports with easy-to-read consumption data. Data can be presented in kWh, kVA, kVArh, power factor, current and voltage formats. The image and clip below provide examples of this:
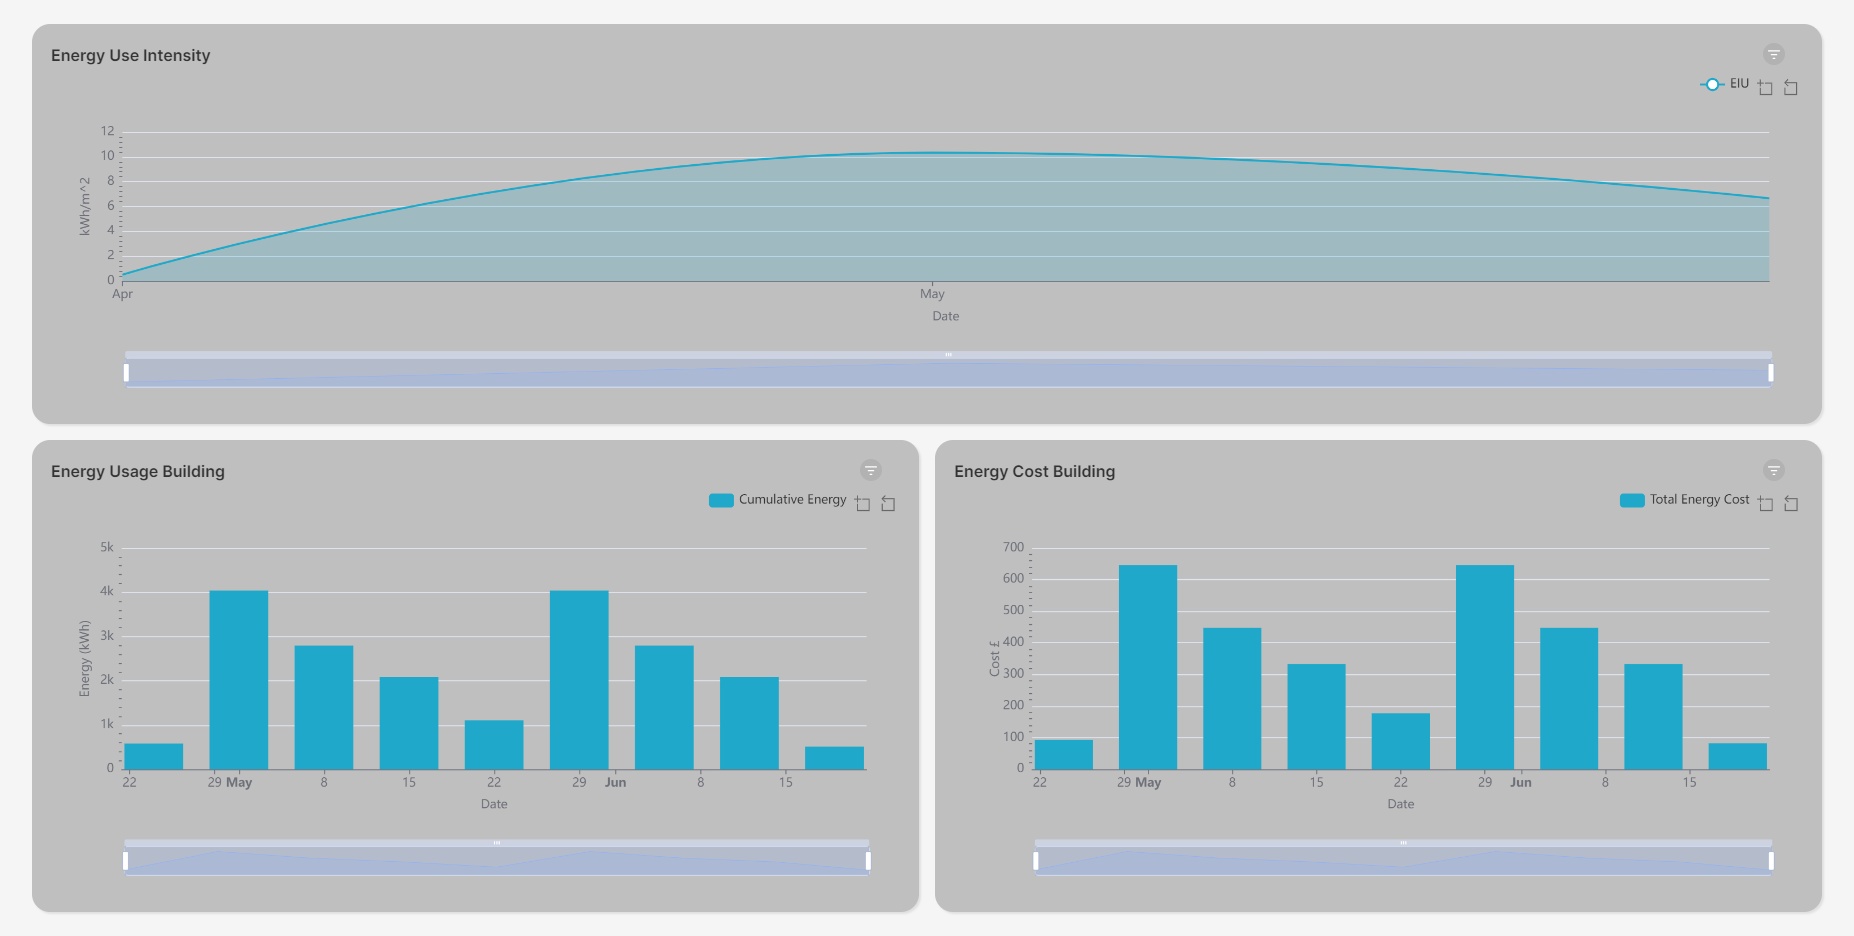
Figure 1 - Monthly Report: Energy
Clip 1 - Energy Reports
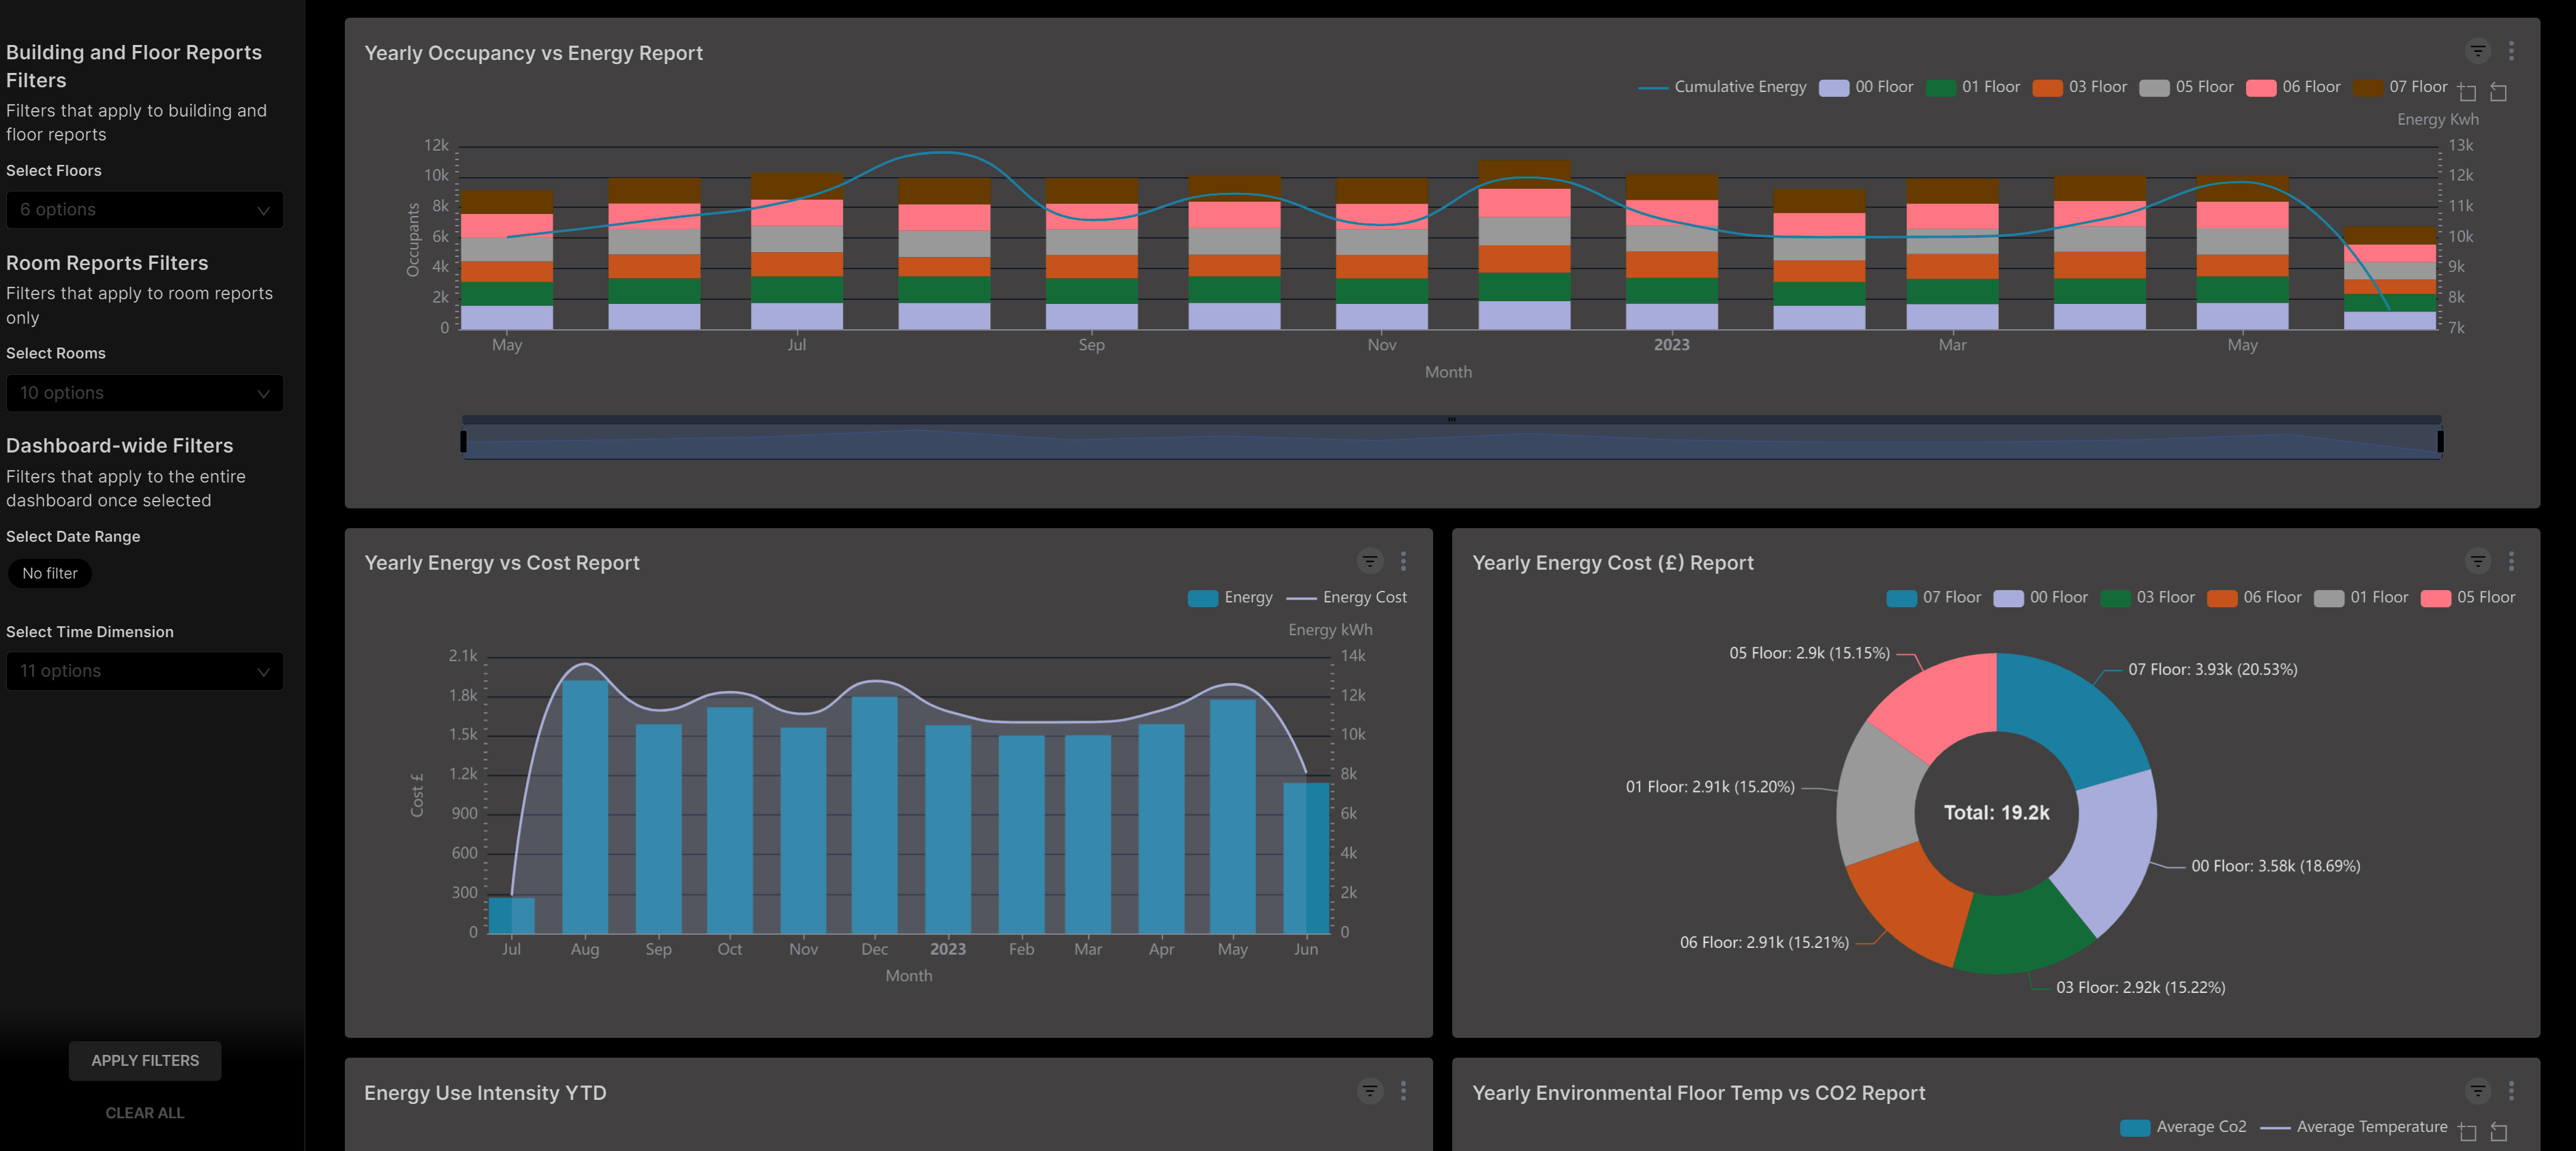
Historical Reporting
The online interface is configurable to compare facilities.
Examples of comparisons include:
- Number of employee/kWh
- Employee/kVA
- kWh/m2/a
- Bed/kWh
- Bed/kVA
The image and clip below represent examples of how this will be showcased on the platform:
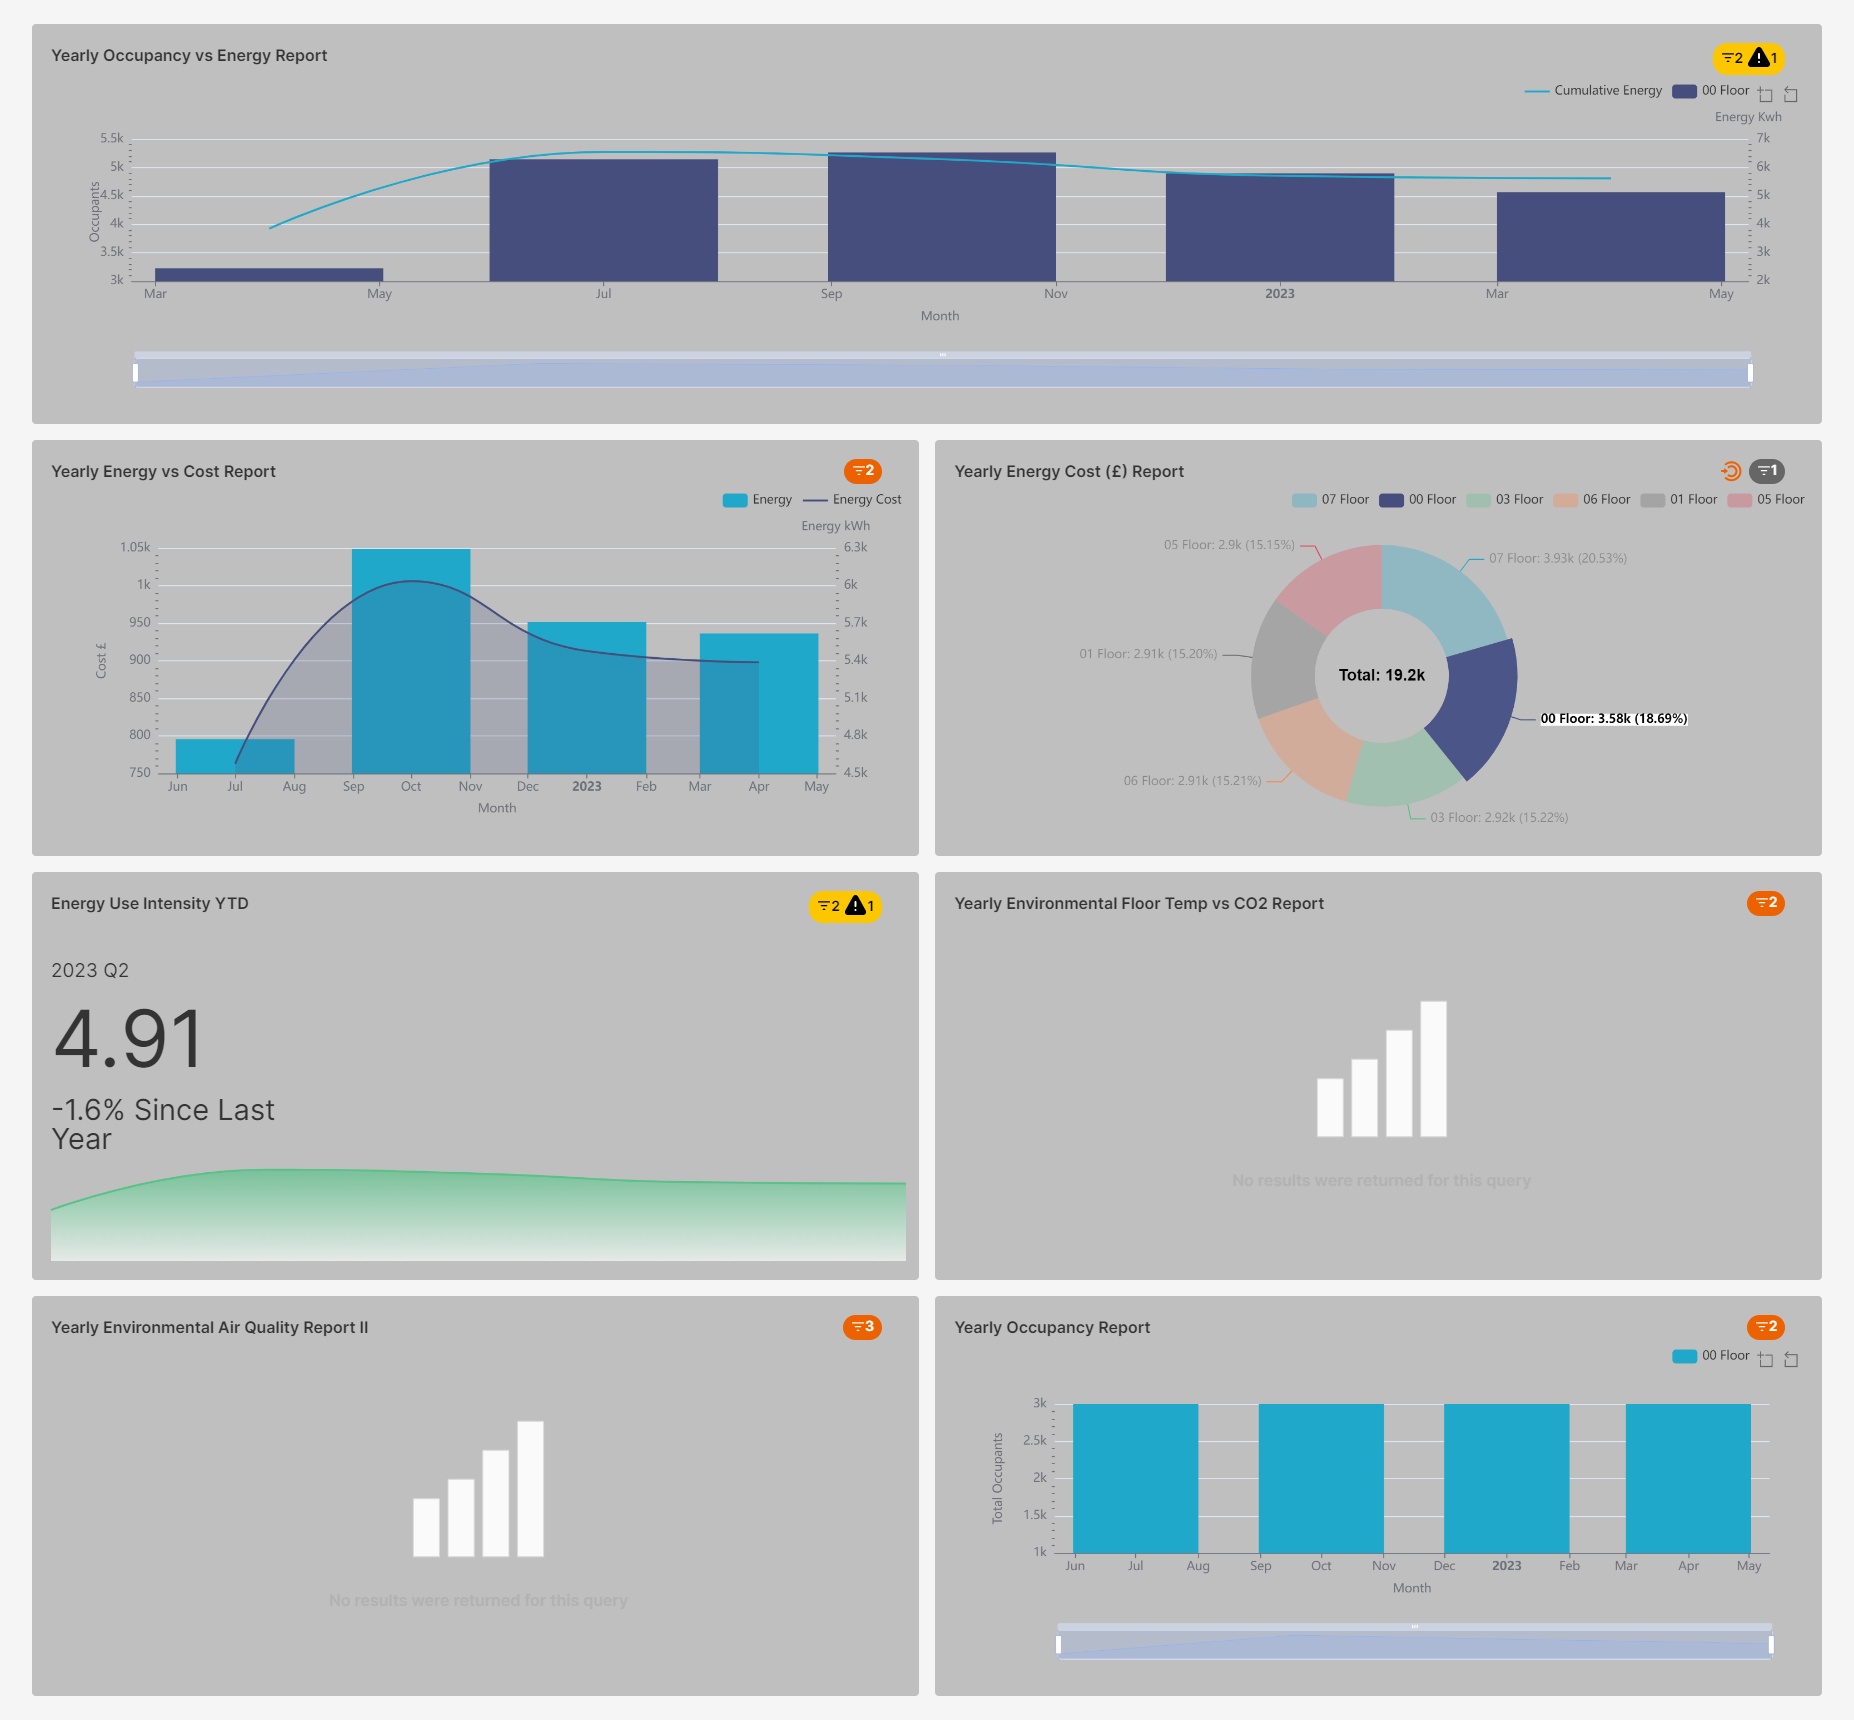
Figure 2 - Historical Reporting
Clip 2 - Historical Reporting
Energy Performance Certificates
The platform provides a user-friendly interface to help clients understand Energy Performance Certificates as per Regulations for the mandatory display and submission of these certificates for buildings dated as of 8 December 2020. The image below shows an example of this interface.
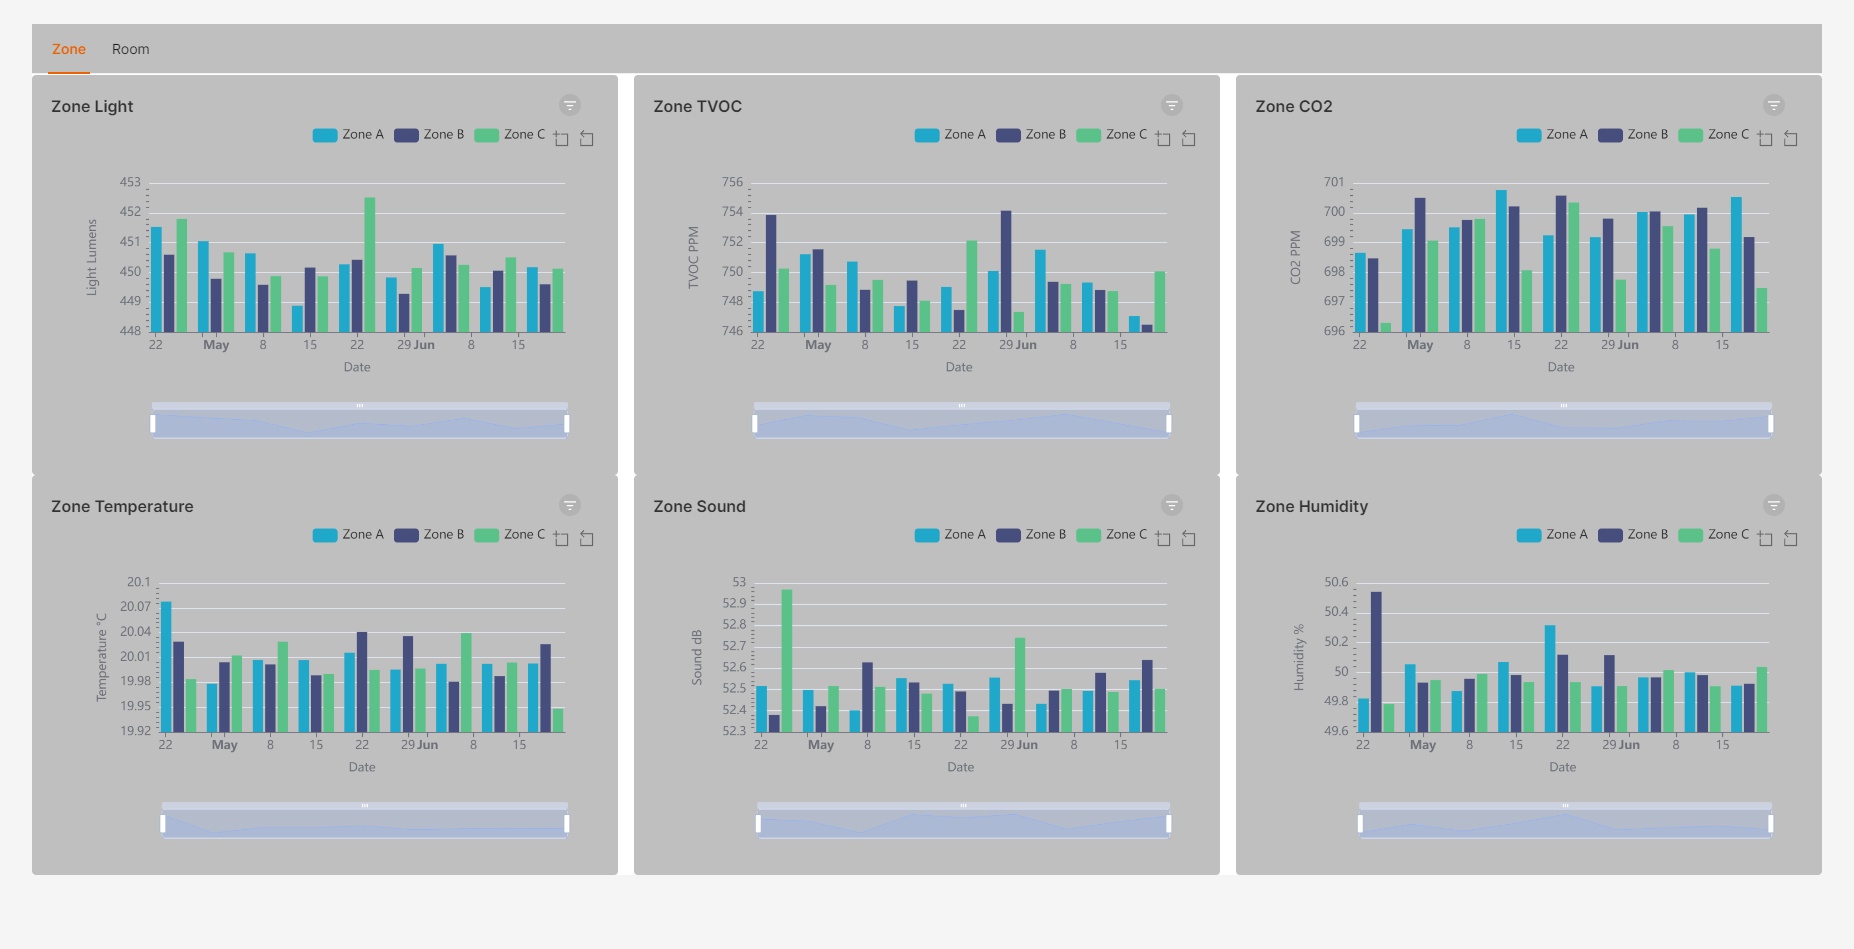
Figure 3 - Environmentals for Energy Performance Certificates