
Blueprints
Sep 1 2022 at 12:00 AM
- Definition
- Key Benefits
- What To Expect From This Guide
- Commander Portal Configuration
- Entity Management
- Blueprint management
- Service Management
- Blueprints and Dashboard Widgets
- Blueprints and Dashboard Widgets
Definition
Blueprints are a Commander™ feature used to group a set of entities together. They can be used for visualisation on dashboards, as well as for exporting data. It is important that blueprints are configured correctly so that users can live stream telemetry data accurately from their endpoints.
Key Benefits
- Allows for grouping of like data sets or products.
- Grouped data can be processed and visualised on dashboards:
- Location tracking
- Tabulated live telemetry
- Provide a structure / schema to export data.
What To Expect From This Guide
This guide explains and takes users through the steps of how to set up blueprints. At the end of this guide, they will know how to:
- Generate a blueprint.
- Tag multiple products (entities) with a blueprint for grouping.
- Manage the blueprints and sites once created.
- Set up exporters and services from those using the blueprints.
- Understand the rules and best practices around using blueprints.
Commander Portal Configuration
In order to generate a blueprint, a user can log in to the Commander platform and navigate to the Portal application.
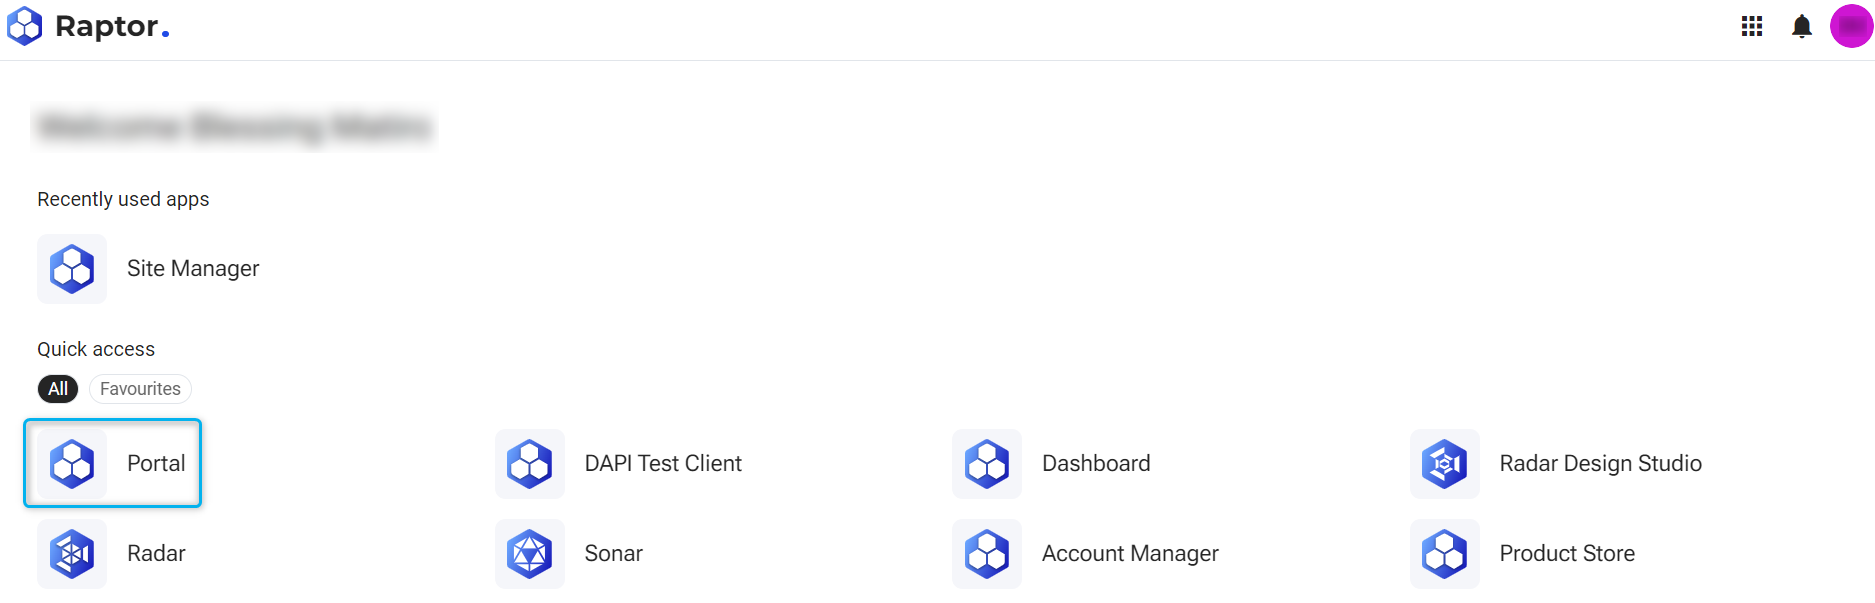
Figure 1 - Commander portal
| This is a management tool that defines the behaviour reflected in the dashboard. |
When the user selects the Portal application option as highlighted in Figure 1, a Commander portal screen is displayed with a collapsed menu bar on the left-hand side. Refer to Clip 1.
Clip 1- Portal Navigation
Entity Management
The following guide assumes that the assets (entities) are already created and linked to live gateways.
Generate Blueprint
When a user is grouping their sites or products together, they need to use blueprints. To generate a blueprint, a user needs to follow the steps illustrated in Clip 2 below.
Clip 2- Generate Blueprint
- Navigate to Entity Management on the menu bar.
- Select one of the entities with the telemetry inside it (the information a user wishes to group/export).
- Click on the Generate blueprint button above the entities tree. After selecting the Generate blueprint button, a New blueprint window will pop up and the user is asked to name the blueprint.
- Give the blueprint a name by entering it in the textbox provided.
- Click the Create button to generate the blueprint.
| The blueprint only needs to be generated once and it is stored in the system. Thereafter, the blueprint can be applied to entities by selecting it in the list when adding a blueprint tag. |
After generating the blueprint, a badge will be displayed in purple in the entity properties section on the right, indicating that the blueprint is applied, see Figure 2 below.
![]()
Figure 2 - Applied blueprint
| The purple badge indicates that the blueprint is applied, and it is healthy. |
| A red badge appears if the blueprint is not applying correctly. It is important to note that if the properties of a blueprint do not match the entities listed in the entity group (or within the group that the blueprint is applied to) it will not be applied (red indicator). Users need to ensure that all properties match before they can continue. |
Applying a blueprint tag
Tagging an entity with a blueprint allows a user to apply an existing blueprint to other entities in order to group multiple sites/groups to one blueprint. To tag an entity with one/multiple blueprints, a user can select the entity in the entity tree and follow the steps illustrated below (see Clip 3).
Clip 3 - Applying a blueprint tag
- Navigate to blueprint on the right-hand side of the window to select the blueprint.
- Click Save and a purple badge will appear indicating that the blueprint is applied. If a red badge appears, this indicates that the blueprint did not apply correctly, which implies that there is something within the tagged entity that does not match the blueprint structure.
An example of tagged blueprints applied and tagged blueprints that did not apply successfully is shown in Figure 3 below.
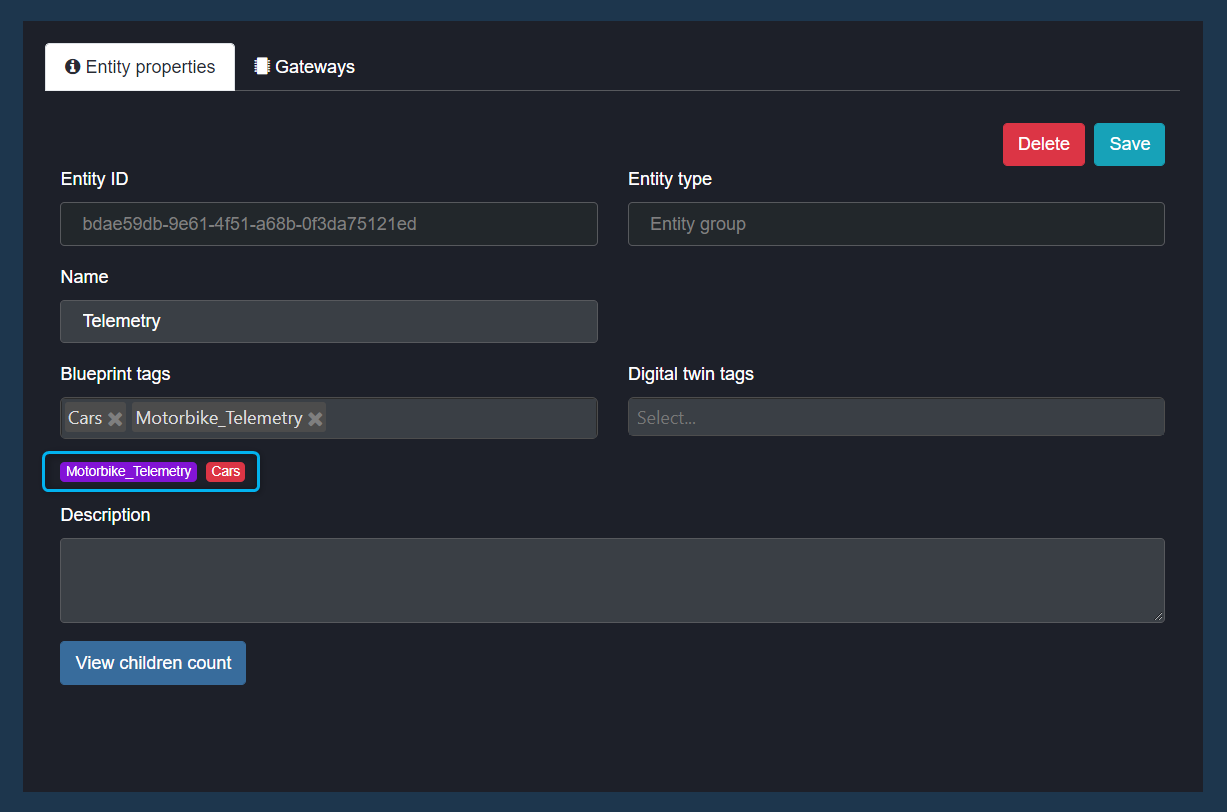
Figure 3 - Tagged blueprint
| A user can tag multiple blueprints to an entity. |
| All entities inside the entity group that the blueprint is tagged to need to match the spelling of the property name within the structure of the blueprint for it to be applied correctly (purple badge). |
Blueprint management
To manage a blueprint, a user can follow the steps illustrated in Clip 4 below.
Clip 4 – Blueprint management
| There is an option to search through the list of all the blueprints. A user can make use of the search option to easily find their blueprint. |
- Navigate to the menu structure in Commander Portal, then select the blueprint management option.
- The window will display all the blueprints on that tenant or account.
- Select the blueprint from the list. The different sets of properties of the selected blueprint are displayed on the right-hand side of the window. These sets can be used to manage the blueprint.
Blueprint tab
This tab shows users the name of the blueprint, and the entities within it that will be grouped within the blueprint. It also displays the specific properties and data type of those entities (see Figure 4) below.
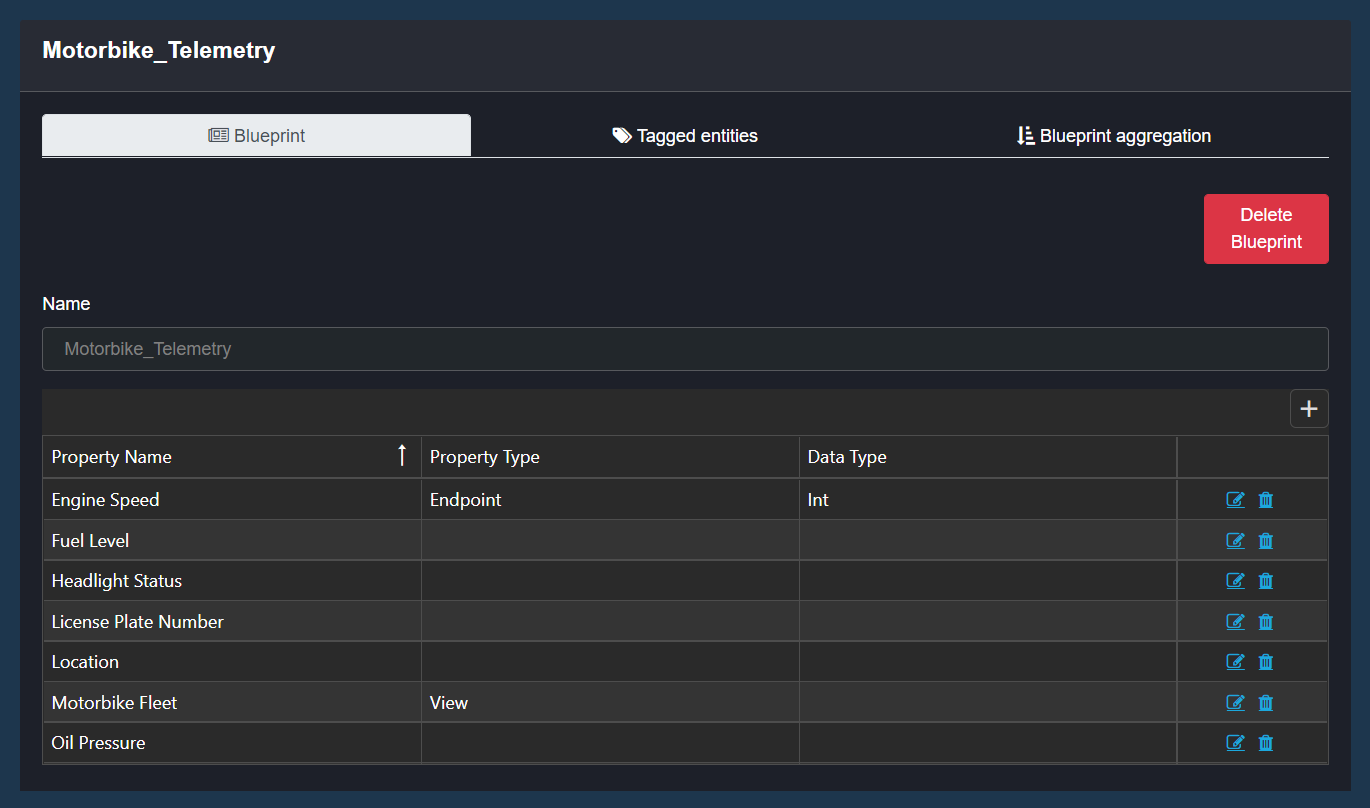
Figure 4 - Blueprint tab in detail
On the Blueprint tab a user can:
- Delete the blueprint by clicking on the Delete blueprint button.
- Edit the current entities within a blueprint.
- Delete existing entities.
- Add new entities.
When the user clicks on the Plus button, a window will open that will allow them to add more properties to their blueprint. Only the property name needs to be defined for an entity to be added to the blueprint. This is illustrated in Clip 5 below.
Clip 5 – Add new property
| If the property type or data type is set/configured within the blueprint in Blueprint management, the entities in the tagged entity group need to match the configuration for the blueprint to apply (purple badge). This does not automatically get configured when generating a blueprint but must be done manually if required. |
| If users add extra endpoints to their tagged entity group, their blueprint needs to be updated to match, that is if they want those entities to be grouped. |
Tagged entities tab
It displays where the blueprint has been applied within the entity tree. The tagged entities tab displays the entities that are tagged with the blueprint selected. Users can see the name of the entity that has the blueprint tagged, as well as that entity’s entity path.
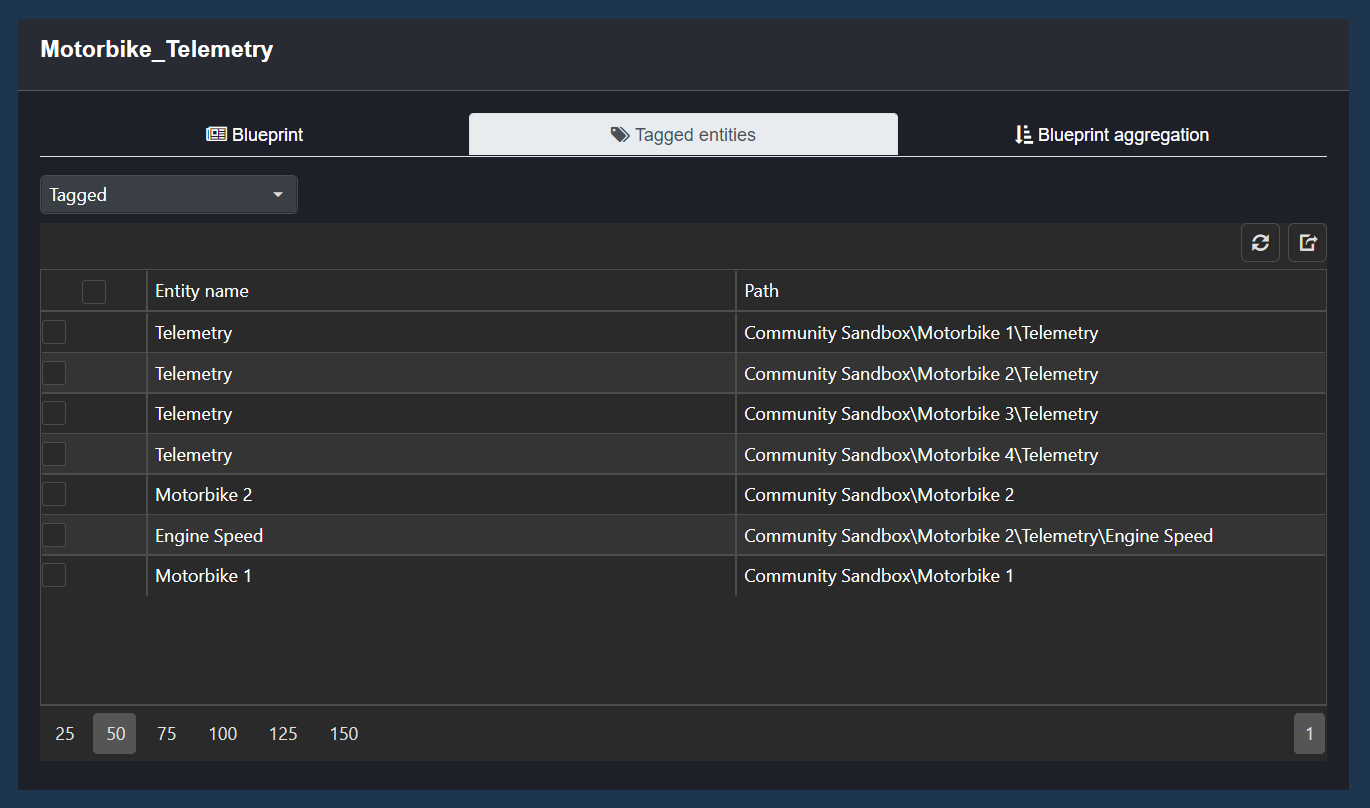
Figure 5 - Tagged entities
From this tab, the list of tagged entities can also be exported as a csv file. The required tagged entities to be exported can be selected on the left of the table by checking the box (all sites can be checked by selecting the box at the top of the list). Once the desired rows are selected, click the export button (see Clip 6) to download the csv list. (Users can download all or just selected rows).
Clip 6 – Exporting tagged entities
The Tagged entities tab also has a dropdown menu that a user can use to filter through their applied, tagged and tagged but not applied entities, see Figure 6 below.
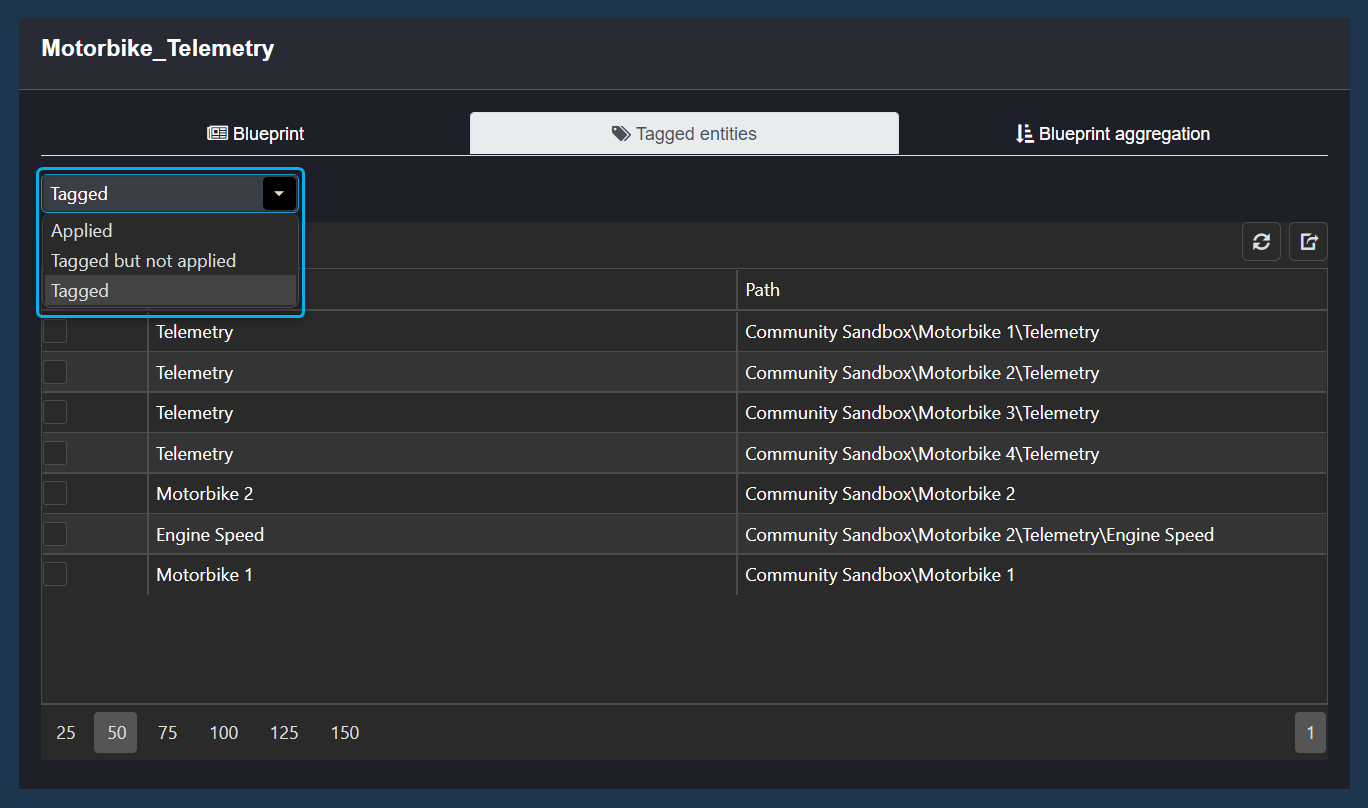
Figure 6 - Tagged, blueprints, applied vs not applied
- Tagged (default selection) - All sites/groups that have the blueprint tagged.
- Applied - All sites/groups that have the blueprint tagged where the blueprint is applied correctly (showing a purple badge).
- Tagged But Not Applied - All sites/groups that have the blueprint tagged where the blueprint is incorrectly applied (showing a red badge).
Blueprint aggregation tab
This is a way to normalize the data. Blueprint aggregation can be toggled OFF or ON. When the aggregation is toggled ON, it will display the list of entities that are currently being aggregated. If there are no entities that are configured for aggregation, in this case they will need to be added.
Clip 7 – Blueprint aggregation set up
- Users can add entities to be aggregated by clicking the plus button. When adding an entity, a window with a list of property options will be displayed. The trash can icon deletes the aggregation. This can be done per entity, or in bulk.
- Select the entity properties to aggregated.
- Click the Apply button to aggregate that data.
- Click the Save button. A message will be displayed in the top right of the screen, indicating that the configuration was successful (see Figure 7).

Figure 7 - Blueprint aggregation saved
Service Management
The Service Management Tool in Commander™ Portal is where users can create Data Exporter Services (to export data collected from Blueprints) and set up services (using Blueprints) for visualisation purposes.
| The following sections only pertain to features in Service Management that are set up using Blueprints. |
Exporting Blueprint Data
Use a Data Exporter Service to export your Blueprint data to a database. This feature can be found in the Service Management Tool in Commander™ Portal.
To export Blueprint data to a database using the Data Exporter Service:
- Navigate to the Service Management Tool in the Commander™ Portal.
Click on the “New” button (Figure 18):
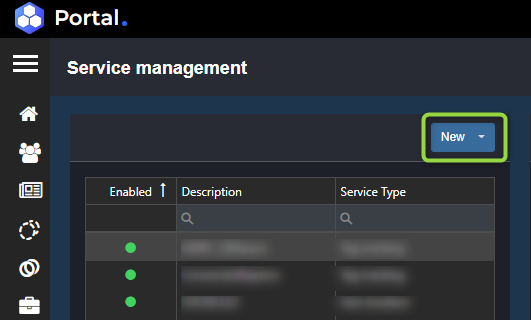
Figure 18 - Click on New Select “Data Exporter” (Figure 19):
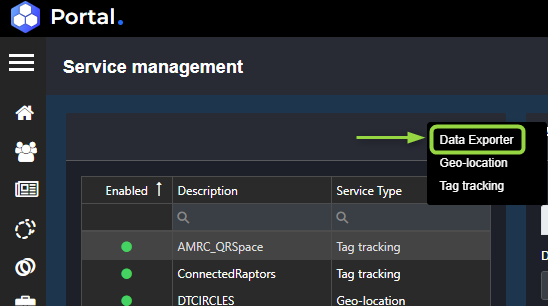
Figure 19 -Select Data Exporter A New service window will open. Name/describe the new Data Exporter Service (1) and click “Create” (2) (Figure 20):
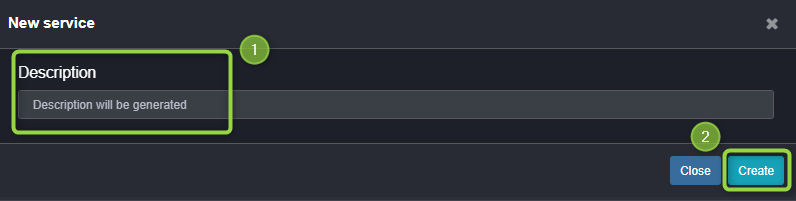
Figure 20 - Name/describe the new service
The newly created Data Exporter Service can then be found in the list of created services on the left-hand side of the Services Management window. Click on the newly created Data Exporter Service to configure its properties. The following window will open (Figure 21):
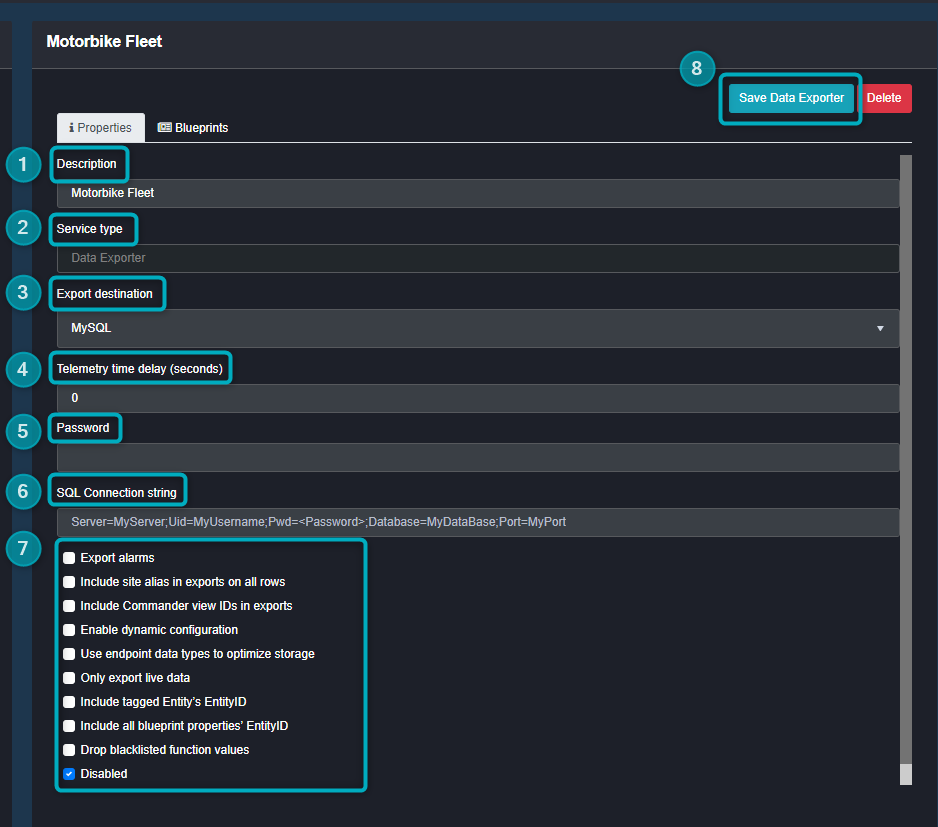
Figure 21 - Configure Data Exporter Service
Under the “Properties” tab, find the following fields:
Description – the description of the data that needs to be exported.
Service type – this will be Data Exporter by default
Export destination – the dropdown will show the following database options to export the data:
- Microsoft Sql
- MongoDB
- Apache Kafka
- MySQL
- BigQuery
- GCP PubSub
Telemetry time delay (seconds) – the time delay for the automatic data transmission from Endpoint data.
Password (v) – [ThisWillBeReplacedWithPasswordInU]
SQL Connection string:
- server=serverIP
- database=databasename
- user=root
- password=ThisWillBeReplacedWithPasswordInU
Other properties that can be selected to be shown in the Service - Select any additional properties and make sure to untick “Disabled” to enable the Service.
The configuration of the Data Export Service’s properties changes according to the database chosen in the Export destination dropdown. Figure 21 above shows the configuration of a Data Exporter Service that sends data to MySQL. Data Exporter Service configurations require the assistance of a DevOps engineer or a Data Specialist. Consult with the relevant parties before enabling your Data Exporter Service. Once the relevant DevOps engineer or Data Specialist has set up the Data Exporter Service, they will verify the data using the Blueprint(s) required for the Data Exporter Service, and then select the relevant Blueprint(s) from the Blueprints tab, as seen in Figure 22: 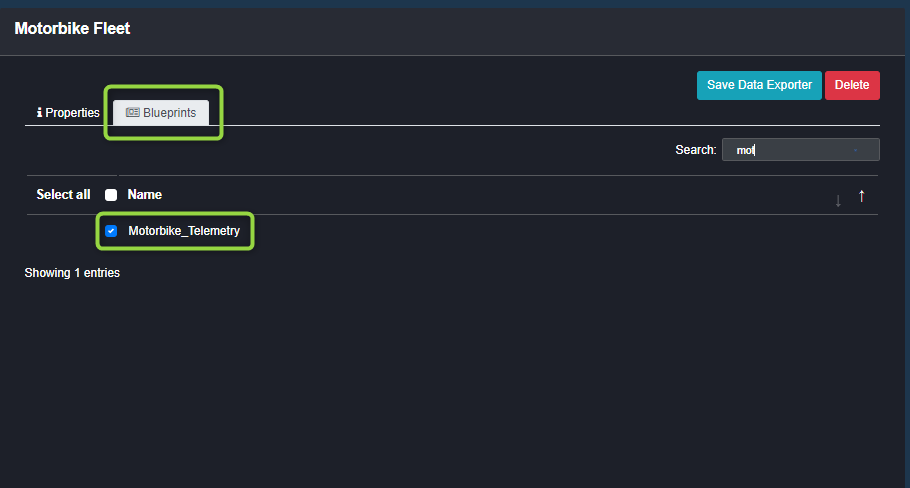
Figure 22 - Data Specialist Selects Blueprints in Data Exporter It is best practice for a Data Specialist to complete the setup of the Exporter Service by verifying the setup and configuration of the entities, Blueprint and Exporter Service before unticking the “Disable” tick box, as shown in Figure 23. Additional tick boxes can be checked depending on the solution. 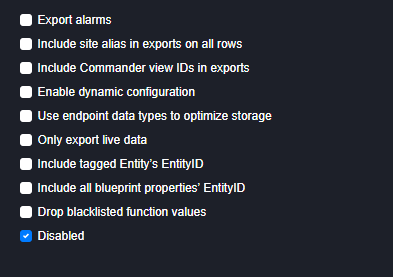
Figure 23 - Data Specialist will Enable Data Exporter Multiple Blueprints can be attached to a single Data Exporter Service. Save Data Exporter - To save and close your Data Exporter Service configuration, click on “Save Data Exporter”.
Geo-Location Services
When building a Dashboard, Geo Maps can subscribe to locations in three different ways:
- Link a Location Endpoint directly from the Entity Tree. This will display all locations manually linked from the Entity Tree.
- Link a Location Property from a Blueprint. This will display all Locations tagged with the Blueprint.
- Configure a Geo-location Service. This will display all Locations tagged with a Blueprint, with additional related configuration properties.
The following sections will show how to configure a Geo-location for a Geo Map (option 3). This includes a guide for creating a Geo-location Service for an application’s Dashboard in the Service Management section.
To create and configure a Geo-location:
- Navigate to the Service Management Tool in the Commander™ Portal.
Click on the “New” button (Figure 24):
Figure 24 - Click on the New Button From the dropdown, select “Geo-location” (Figure 25):
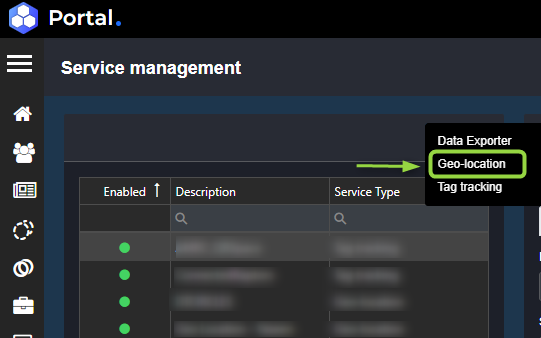
Figure 25 - Click on Geo-location A New service window will open. Name/describe the new Data Exporter Service (1) and click “Create” (2) (Figure 26):
Figure 26 - Name/describe the new service
The name of the newly created Geo-location will appear in the list on the left-hand side of the Service Management window. Find the relevtant Geo-location service and click on it. The Properties of the selected Geo-location will show in the middle of the page (see Figure 27). Most fields will be auto-filled. Below find descriptions of these fields:
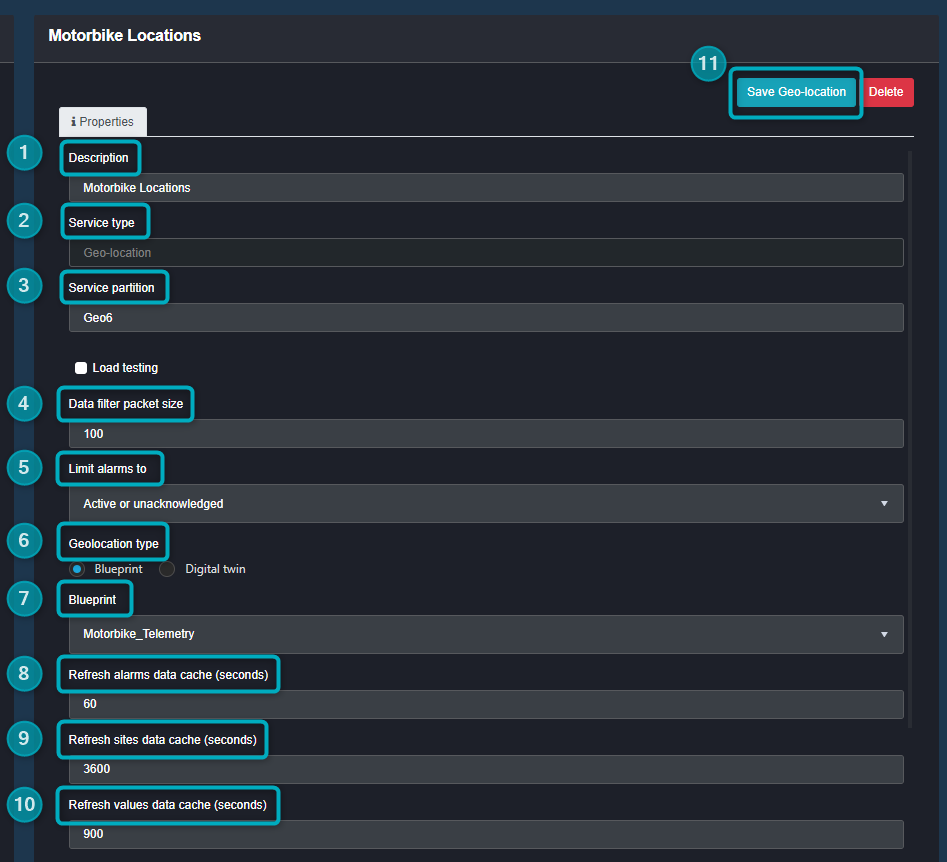
Figure 27 - Geo-location properties
In this Properties section, you’ll find the following fields:
Description - the name of the Geo-locataion
Service type - this will be auto-filled as Geo-location
Service partition - this will be auto-filled
Data filter packet size - this will be auto-filled and indicates how many locations will be shown in the Geo-location service (eg 100 locations will show per Geo-location map)
Limit alarms to - this allows the user to configure selected alarms to be cached in the Geo-location service. Choose from the following options:
- Active or unacknowledged
- Active alarms only
- Unacknowledged alarms only
Geo-location type - this will automatically be ticked as Blueprint
Blueprint - since the Geo-location type is Blueprint, a dropdown will be made available that allows the user to choose the Blueprint required for this service. Search for the relevant Blueprint in the dropdown and select it. The name of the relevant Blueprint will appear in the input box underneath the heading. Depending on the solution, the user may also select Digital Twins. If this is selected a dropdown will show Digital Twin options and the user will be able to select the relevant Digital Twin for the configuration.
Refresh alarms data cache (seconds) - choose the cache reset timeframe (in seconds) for alarms. This is automatically set to 60 seconds but can be adjusted depending on the solution’s configuration.
Refresh sites data cache (seconds) - choose the cache reset timeframe (in seconds) for the site entity. This is automatically set to 1 hour (3600 seconds) but can be adjusted depending on the solution’s configuration.
Refresh values data cache (seconds) - choose the cache reset timeframe (in seconds) for the site telemetry. This is automatically set to 15 minutes (900 seconds) but can be adjusted depending on the solution’s configuration.
Save Geo-location - Once you’ve configured the Geo-location service, save and close the configured properties.
The following settings are also available in the Geo-location configuration table (see Figure 28).
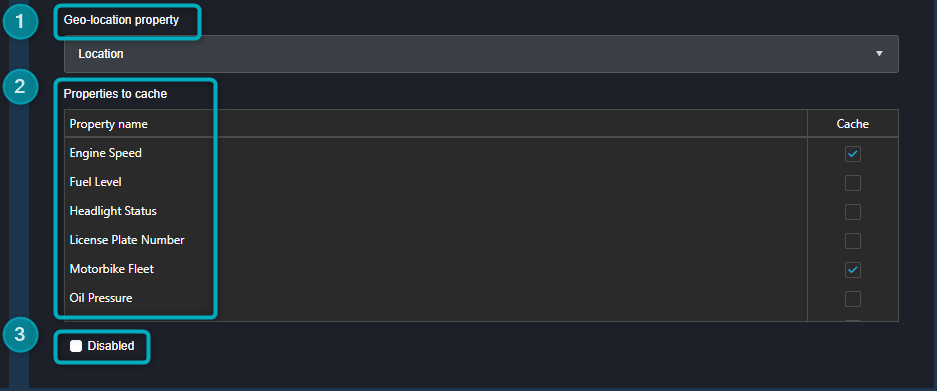
Figure 28 - Geo-location Properties Cont.
Geo-location property - this heading provides a dropdown with options for the Geo-location property.
Always select the Location or Coordinate entity for this property as it creates the location backbone of the service (see Figure 28). 
Figure 28 - Select Location or Coordinate Properties to cache - these are properties from the selected Blueprint that can be displayed in the service (when the data is visualised on the Dashboard). If, for example, the Endpoint properties you want to visualise are from a “Motorbike Locations” (as in the example shown in the Figures below), important properties/Endpoints to cache would include the License Plate Number (asset indicator) and the Dashboard View entity (created for navigation purposes within the Geo Map). Other properties can be selected depending on the solution’s configuration (to be used in Tool Tips in Dashboard).
Disabled tick box - once you have configured your settings, untick the “Disabled” tick box to enable the service.
Once the properties have been configured and the settings have been enabled for the Geo-location, there will be a green dot next to the Geo-location service name, indicating that the newloy created Geo-location service is active (see Figure 29).
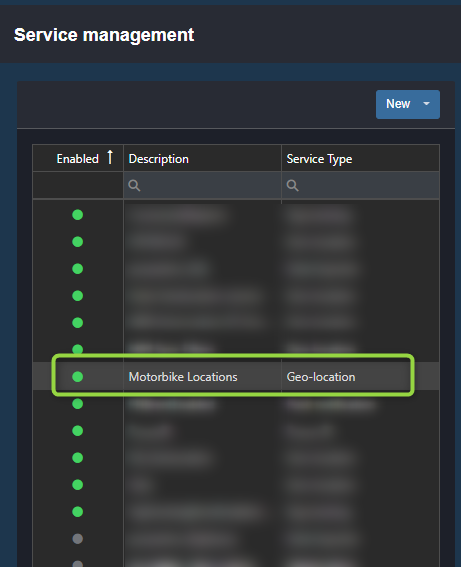
Figure 29 - Geo-location Active
After the Geo-location service has been activated in Service Management, navigate to the Dashboard to configure the Geo Maps widget.
Blueprints and Dashboard Widgets
Blueprints as a group, or their individual properties, can be used to visualise data on a Dashboard. A number of Widgets are able to use Blueprints and their properties to show and compare information from all tagged entities, which include (but are not necessarily limited to):
- Data Grids
- Geo Maps for:
- Direct Subscriptions to Blueprint Location Properties, and
- Geo-location services (see previous sections in this document)
Blueprints and Dashboard Widgets
Blueprints as a group, or their individual properties, can be used to visualise data on your Dashboard. A number of Widgets are able to use Blueprints and their properties to show and compare information from all tagged entities, which include (but are not necessarily limited to):