
Geo Map Widget
Jan 1 2022 at 12:00 AM
Geo Maps display location data linked to the map widget from either Entites, Blueprints, Digital Twins or a Geo-location Service. These linking options are not mutually exclusive. A Geo Map can subscribe to more than one location property per map. However, only one Geo-location Service can be configured per Geo Map. A Geo Map can also use historic data to show the path that the configured location has travelled (when subscribed locations are from Entities, Blueprints or Digital Twins).
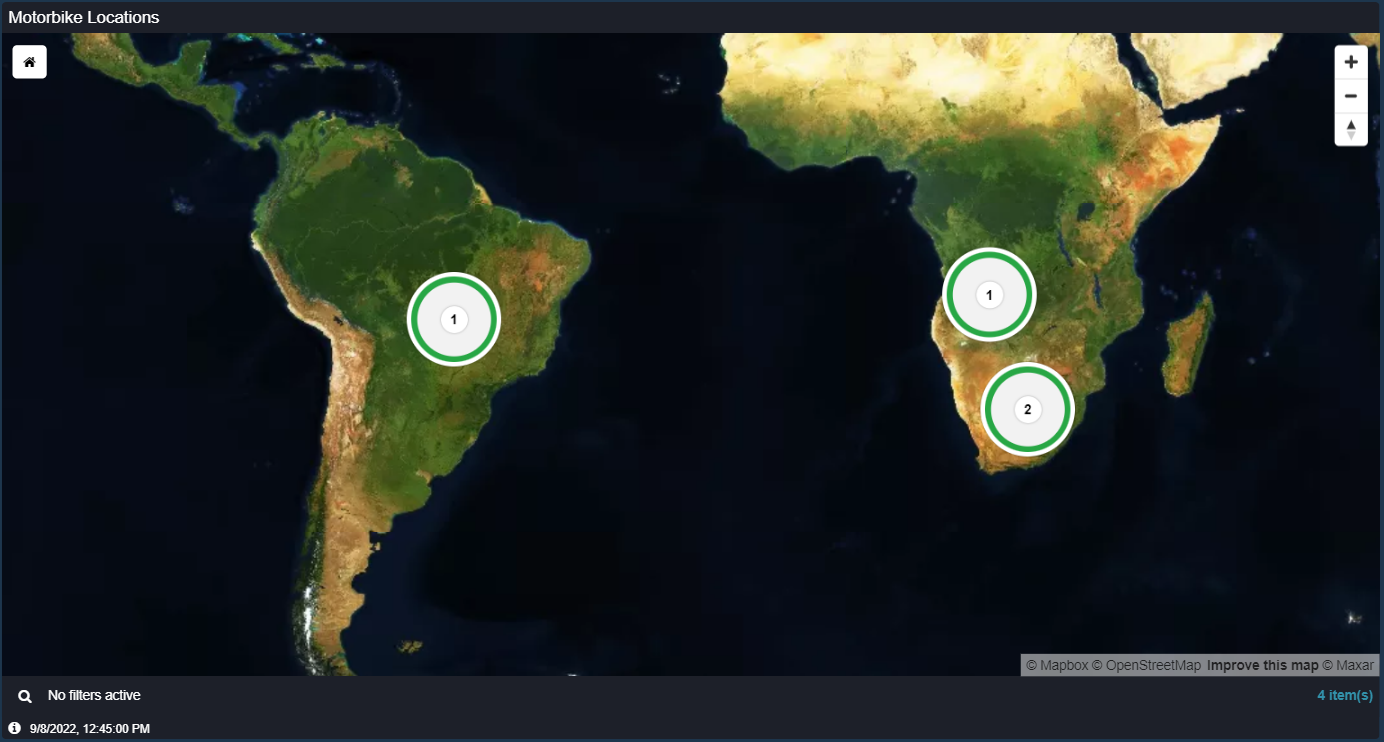
Figure 1 - Geo Map (Default size: 4 row x 5 col, Minimum Size: 2 x 2, No Max Size)
Figure 19 shows an example of a Geo Map widget which is displaying location data in Alarm Circle format.
The following will be discussed in this section:
- Subscribe / link locations to your Geo Map widget using:
- Entities (location Entities from the Entity Tree)
- Blueprints (tagged Blueprints with locations)
- Geo-location Services
- Entities (location Entities from the Entity Tree)
- Subscriptions
- Editing Geo Map Properties
- The Geo Map Filter
Geo Map Subscriptions
You can link locations to your Geo Map using the following (found in Geo Map Properties):
- Location Entities - subscribe locations using the Endpoints tab inside Geo Map Properties.
- Blueprints - use a Blueprint to subscribe a location property to your Geo Map.
- Geo-location Service - create a Geo-location Service (see more here) with your Blueprint, then configure your Geo-location Service in Geo Map Properties.
- Digital Twins - Digital Twins can be used instead of Blueprints. Find out more about Digital Twins here.
| When using Blueprints to subscribe locations to Geo Maps, the selected Blueprint needs to be applied to sites correctly (purple tag) for the locations to be displayed. |
Subscribing to Location Entities
You can link one location at a time to your Geo Map widget using location Entities. Click on the Endpoints tab in Geo Map Properties, select a location Entity from the Entity Tree and drag and drop the location into your Geo Map:
Clip 1 - Drag Entity Location onto Geo Map
You can drag and drop multiple location Entities from the Entity Tree onto one Geo Map. This method is not recommended if many locations need to be added, as this would require the user to search and add multiple individual location Entities.
If the solution requires scalability, it is recommended that Blueprints, Digital Twins (for more click here) or a Geo-location Service be used. The sections below will discuss how to configure your Geo Map using a Blueprint or Geo-location Service.
Subscribing to a Blueprint Property
To use a Blueprint to configure your Geo Map, ensure the relevant Blueprint is tagged and applied to all assets that include the locations you want to view in your Geo Map. Search for your Blueprint in the Blueprint tab (in Geo Map Properties) and link the location property in this Blueprint to the Geo Map:
Clip 2 - Drag Blueprint onto Geo Map
As shown in the video clip above, once the location property of the Blueprint has been dragged onto the Geo Map, the map will show the configured locations of all sites to which the Blueprint has been applied.
Subscribing to a Geo-Location Service
To use a Geo-location Service to configure your Geo Map, first set up a Geo-location Service in Service Management.
On the Properties tab of the Geo Map widget, click on Advanced Properties. Scroll down to the Geo Location Service menu, select your Geo-location Service and click on the Configure button:
Clip 3 - Subscribe a Geo-location Service
This will open a Service configuration window. You can configure the following fields (Figure 20):
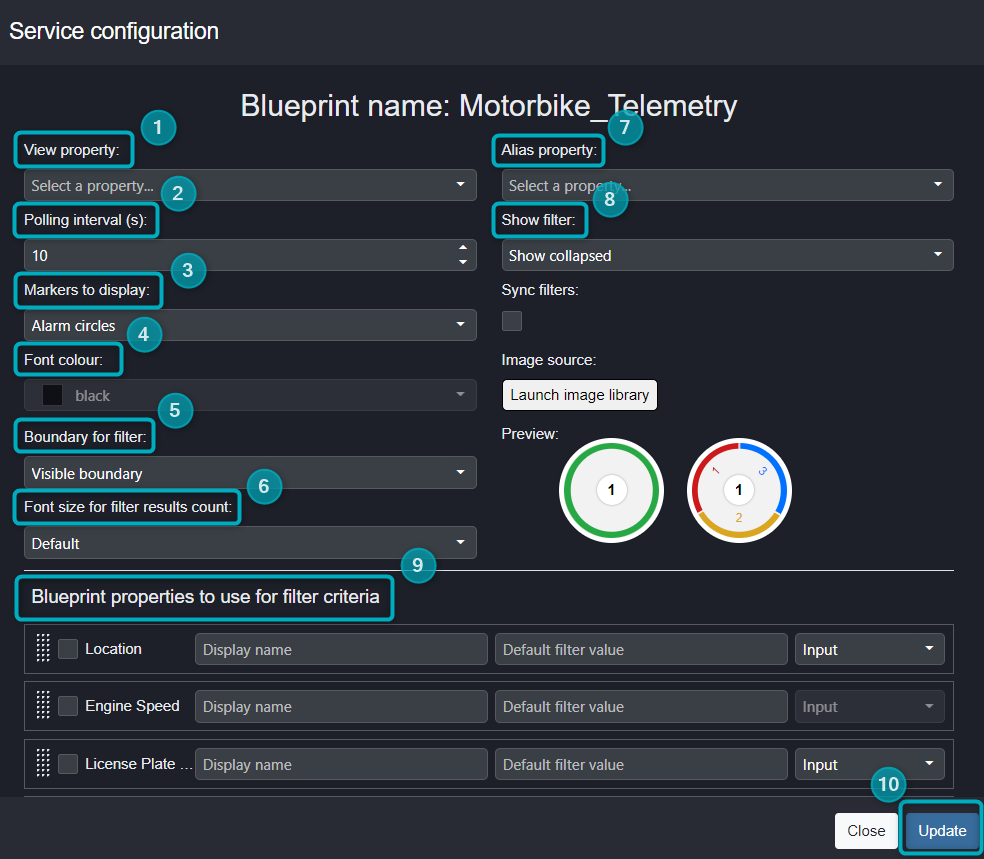
Figure 2 - Service configuration
View Property - choose the view Entity you wish to associate as the click-through option from the location on the map (in this case it’s the “Motorbike Fleet” view, as shown in Figure 20).
You can only select a view if there is a View Entity in your Entity Tree and Blueprint. The property will show as an option in the dropdown if it has successfully been cached in Geo-location Services. Polling interval(s) - choose the interval within which you want to poll your data.
Markers to display - the dropdown shows different style markers for different use cases. You can choose from:
- Alarm Circles - displays the locations showing alarms. As you zoom out on the map, the sites will group together. The number of sites within an area is displayed as the number in the center of the alarm circle. Individual numbers of the grouped alarms per site within this circle will show around this number, colour-coded (green = none; red = high; yellow = medium; bule = low).
- Images - an icon / image can be uploaded for the display (it will be added to the center of the marker or Alarm Circle).
- Markers - this will display a pin icon.
- The Preview on the right will change as you change these settings, providing a preview of the displayed data.
- Alarm Circles - displays the locations showing alarms. As you zoom out on the map, the sites will group together. The number of sites within an area is displayed as the number in the center of the alarm circle. Individual numbers of the grouped alarms per site within this circle will show around this number, colour-coded (green = none; red = high; yellow = medium; bule = low).
Font colour - this will be black by default.
Boundary for filter - when filtering sites with the filter table (found on the Geo Map widget), the sites found within the filter can be displayed in two ways:
- Visible boundary - only sites within the map border area will be visible in the filter table. Zoom in or out to exclude / include sites in the filter table.
- Ignore boundary - all sites will always be filterable, whether or not they are visible within the map boundary / border.
- Visible boundary - only sites within the map border area will be visible in the filter table. Zoom in or out to exclude / include sites in the filter table.
Font size for filter results count - choose your font size for the filter results number.
Alias property - the “friendly name” for your asset locations. For a fleet of motorbikes (for example), a Licence Plate Number would be a good example as an Alias property configuration. This Entity will need to exist in the Entity Tree stucture of your asset / site (Entity Management) and must be a property within your Blueprint to be identified by the Geo-location Service.
Show filter - show or hide the filter table in the Geo Map widget. If set to “hide”, the magnifying glass at the bottom right-hand corner of the Geo Map widget can be clicked to expand the filter table. Options include:
- Hide
- Show collapsed
- Show expanded
- Hide
Blueprint properties to use for this criteria - select the cached properties from your Blueprint to be used in your Geo Map filter.
Update - once you have configured your settings, update the Geo Map in the Dashboard.
Once configured, when the Geo-location Service sends values, they are plotted on the map. If locations are configured as Alarm Circles and there are multiple locations in proximity, they will be grouped or clustered and the data aggregated. If you right click, the map will display Tooltip data, if you left click it will click-through to the view.
Subscriptions
Click on the Subscriptions tab (in Geo Maps Properties) to see all locations subscribed to your map (Figure 21):
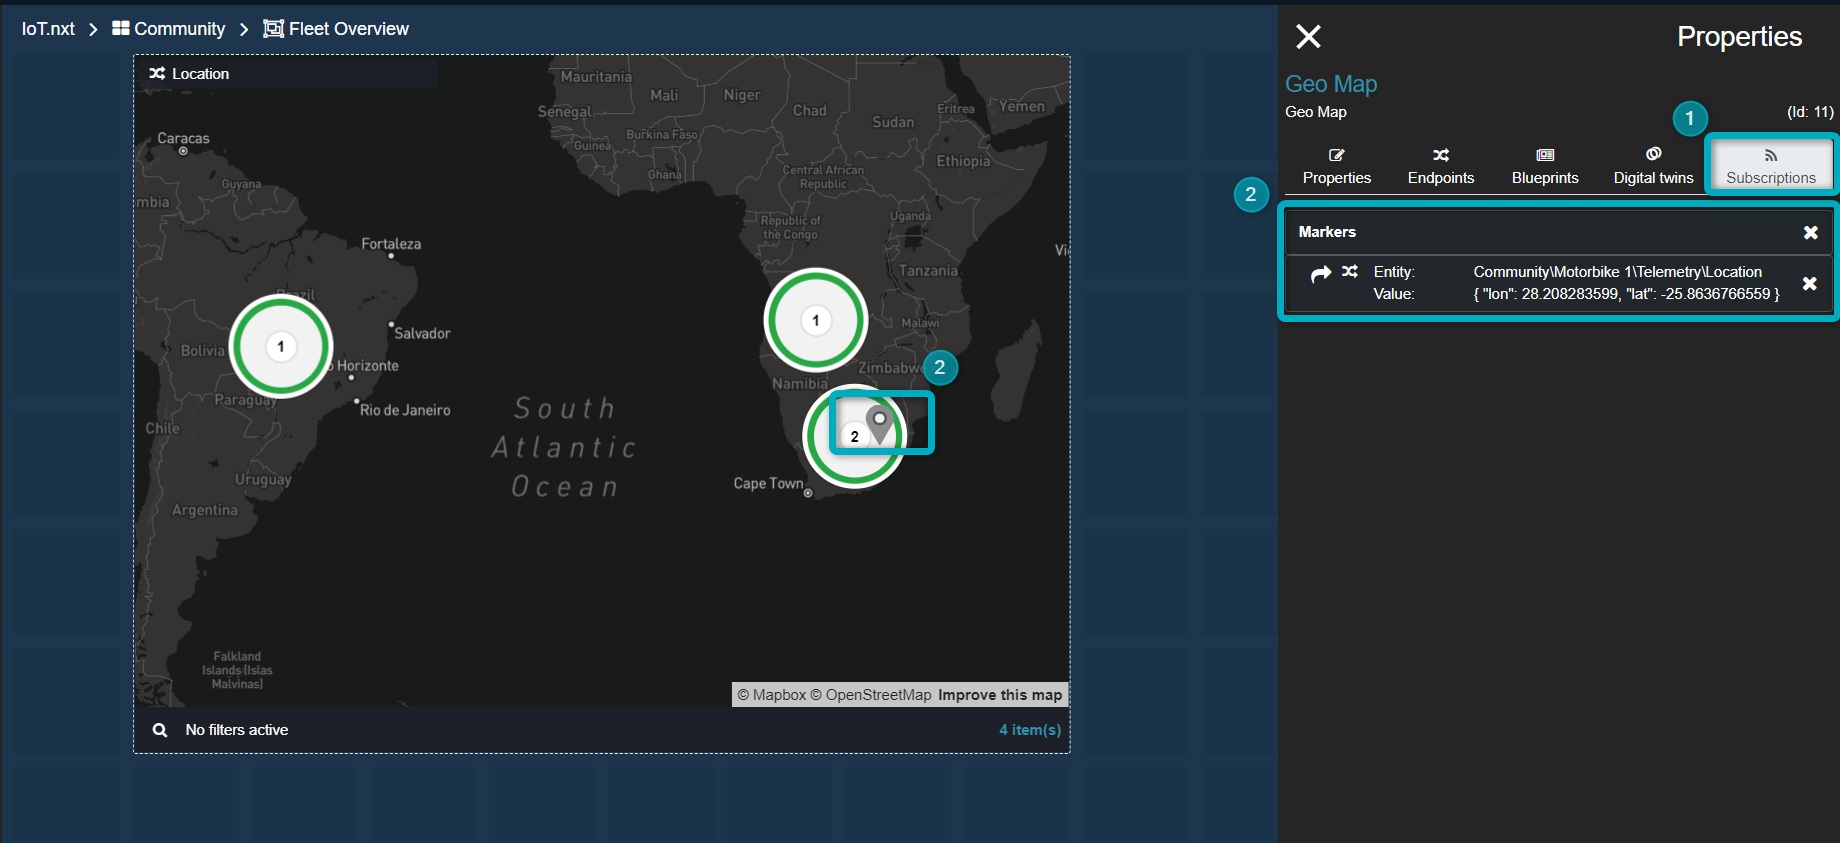
Figure 3 - Subscriptions
Subscriptions tab - click to expand the Subscriptions tab.
Subscribed location markers on your Geo Map - pin markers and Alarm Circles in your Geo Map subscribed to Entity locations and / or Blueprint locations. This list shows the file path and location coordinates of each subscribed location.
| If you have subscribed locations to your Geo Map using Blueprints, the Bluerint subscriptions information will look like this: |
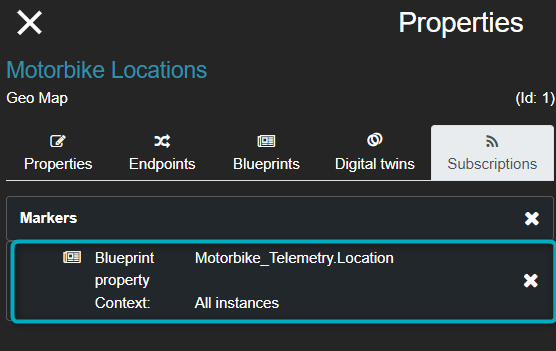 |
| Figure 42 - Subscriptions and Blueprints |
| Only information about locations subscribed to the Geo Map using Entity, Blueprints or Digital Twins locations (drag and dropped onto the Geo Map) will be seen in your Subscriptions tab. Information about Geo-location Service locations will not be available under Subscriptions in Geo Map Properties. |
| You can delete subscriptions by clicking on the x on the right-hand side of the Markers information. |
Configure Geo Map Properties
Various Geo Map configurations can be edited in Geo Maps Properties once your locations have been subscribed to the Geo Map widget. Configuration options for Geo-location Services and Historic data will only be available if the Advanced Properties tickbox has been activated.
Configuration options include:
- Tile Configuration
- Controls
- Geo Location Services - available when the Advanced Properties tickbox is activated. For more read here.
- Historic data - available when the Advanced Properties tickbox is activated.
- Map - including Tooltip Builder.
The sections below will discuss these configurations:
Tile Configuration
The Tile Configuration section in Geo Map Properties allows you to set styles for your Geo Map widget (Figure 23).
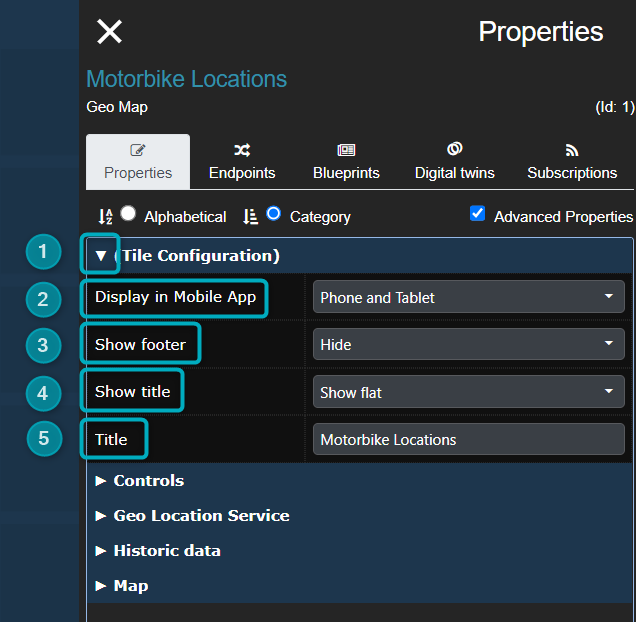
Figure 5 - Tile Configuration
Open Tile Configuration - click on the dropdown to expand the Tile Configuration section.
Display in Mobile App - options for tile views for different devices.
Show footer - the dropdown will allow you to either hide, show the date and Endpoint history or only show the date of your configured Geo Map. This will show at the bottom left-hand corner of the Geo Map widget:
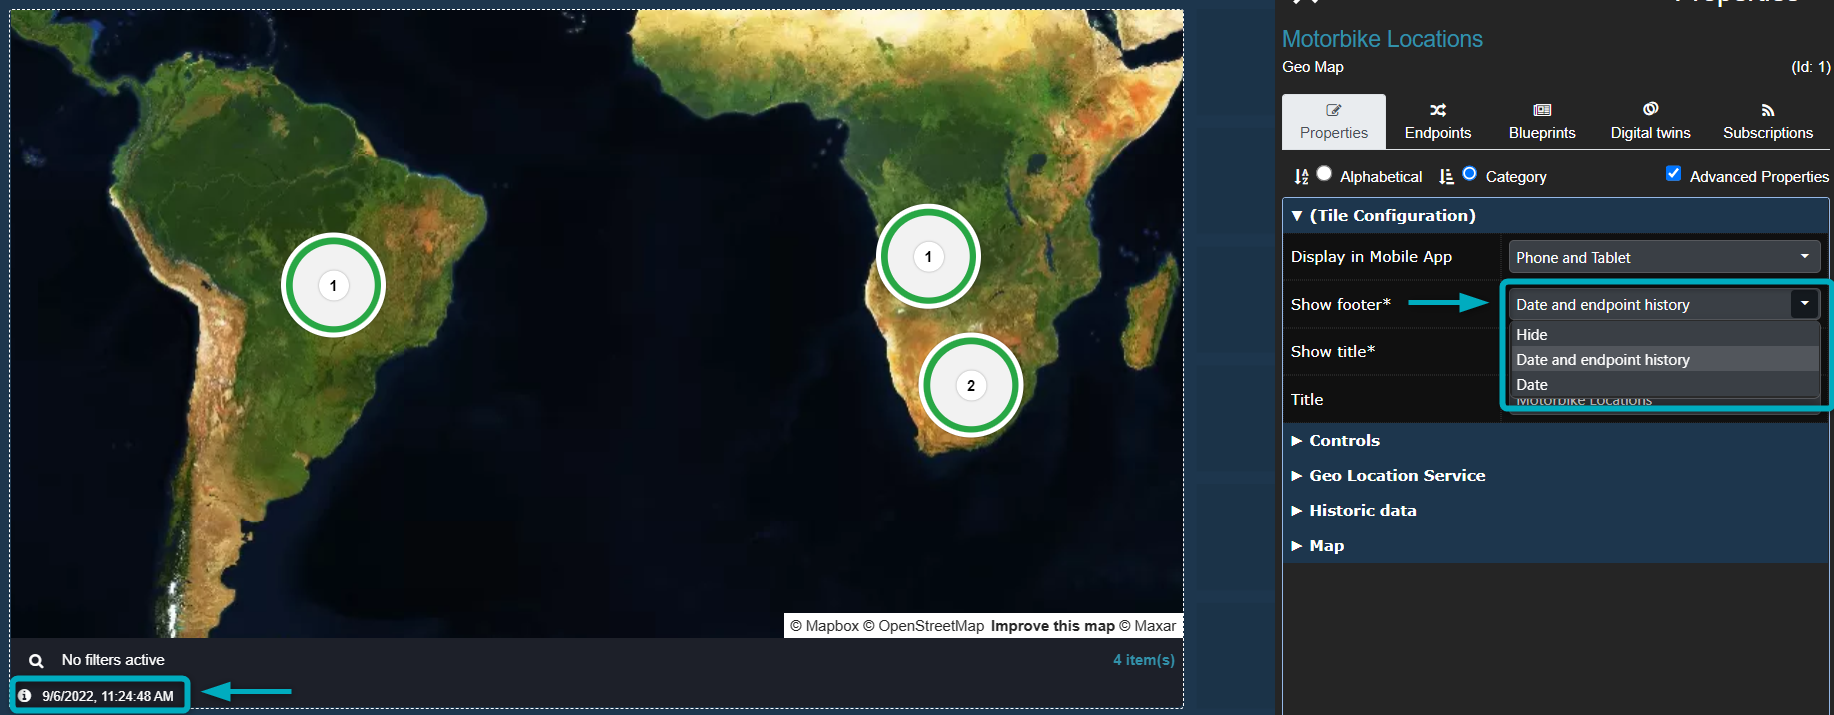
Figure 6 - Show footer - configure options - Date - the last time data was updated for this Geo Map.
- Information icon - you can click on the information icon to see Endpoint history (this will not be available if the location was applied as a Geo-location Service).
If “and show endpoint history” is selected to show, when a user views the Dashboard they can click on the information icon next to the date and time (bottom left-hand corner of the widget) to open a historic values window showing location history. Show title - the dropdown lets you hide, show a flat title or show a raised title. This will show at the top left-hand corner of the Geo Map widget:
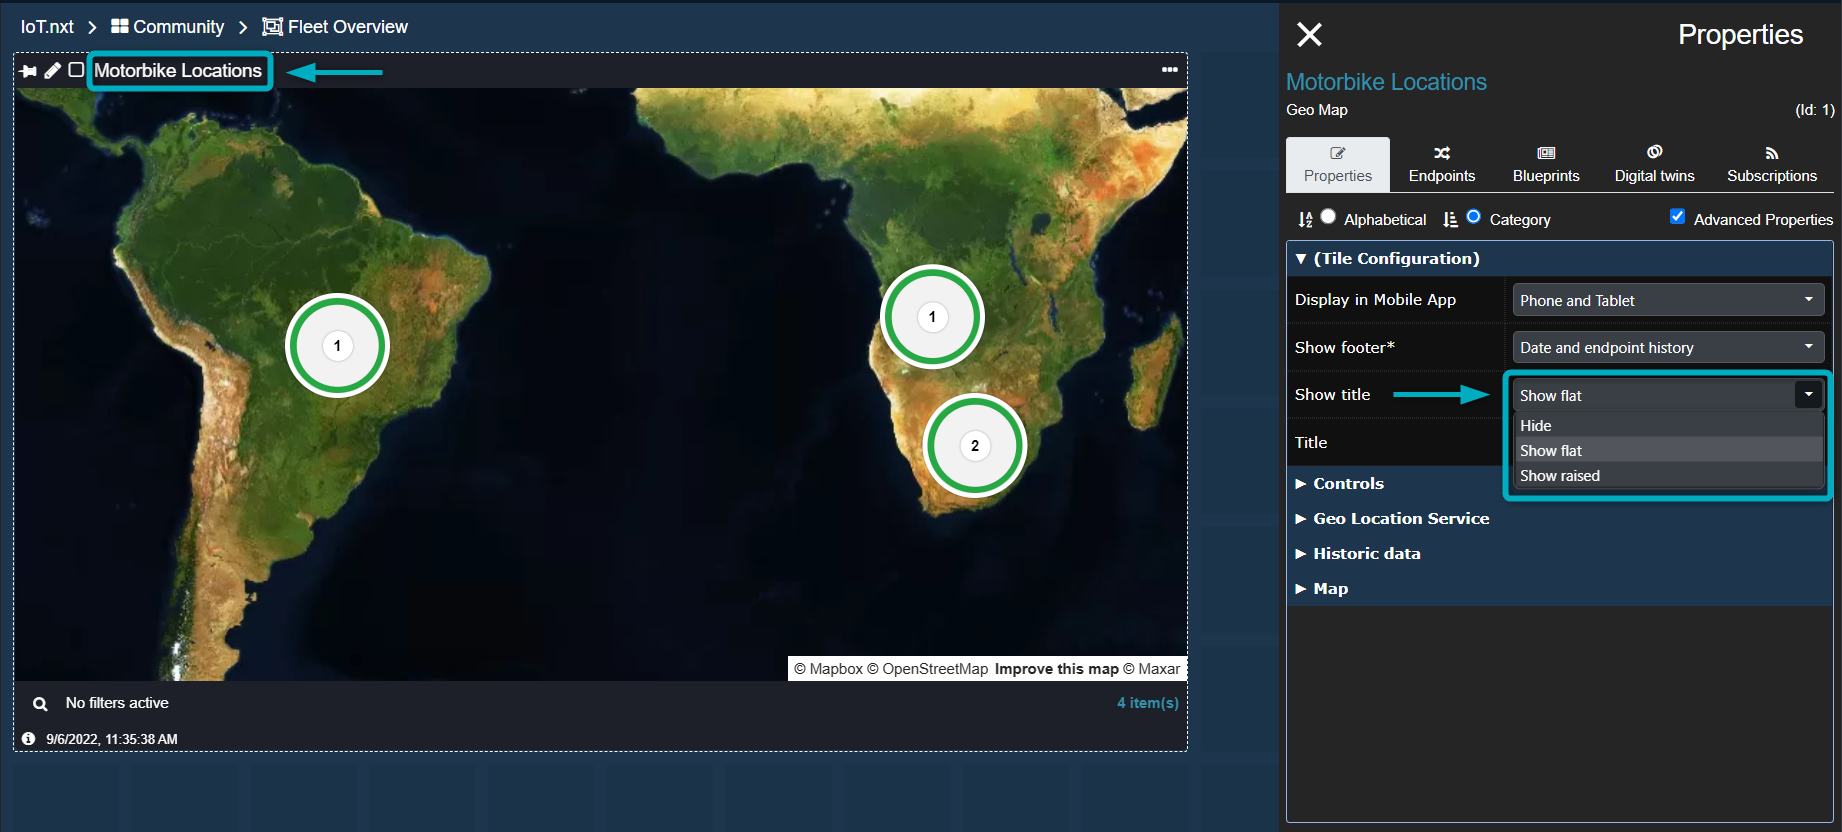
Figure 7 - Show title - configure options Title - the title of your Geo Map widget.
Controls
Controls provide additional functions to your Geo Map widget (Figure 26).
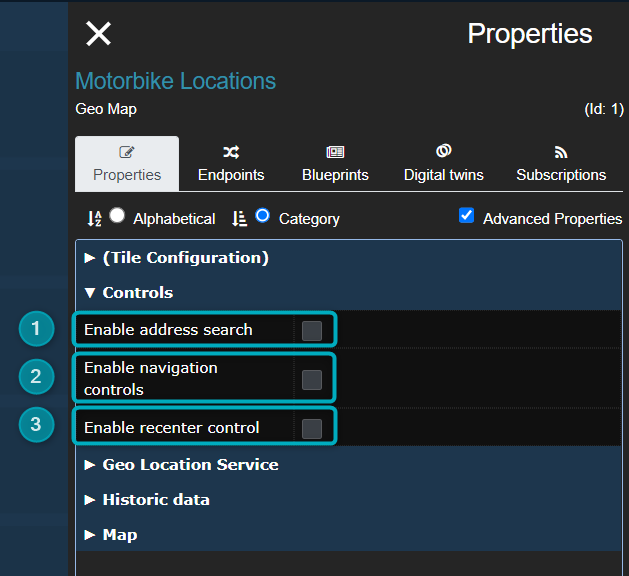
Figure 8 - Controls
Enable address search - search for an address in your Geo Map widget. Note that you can only search for street addresses.
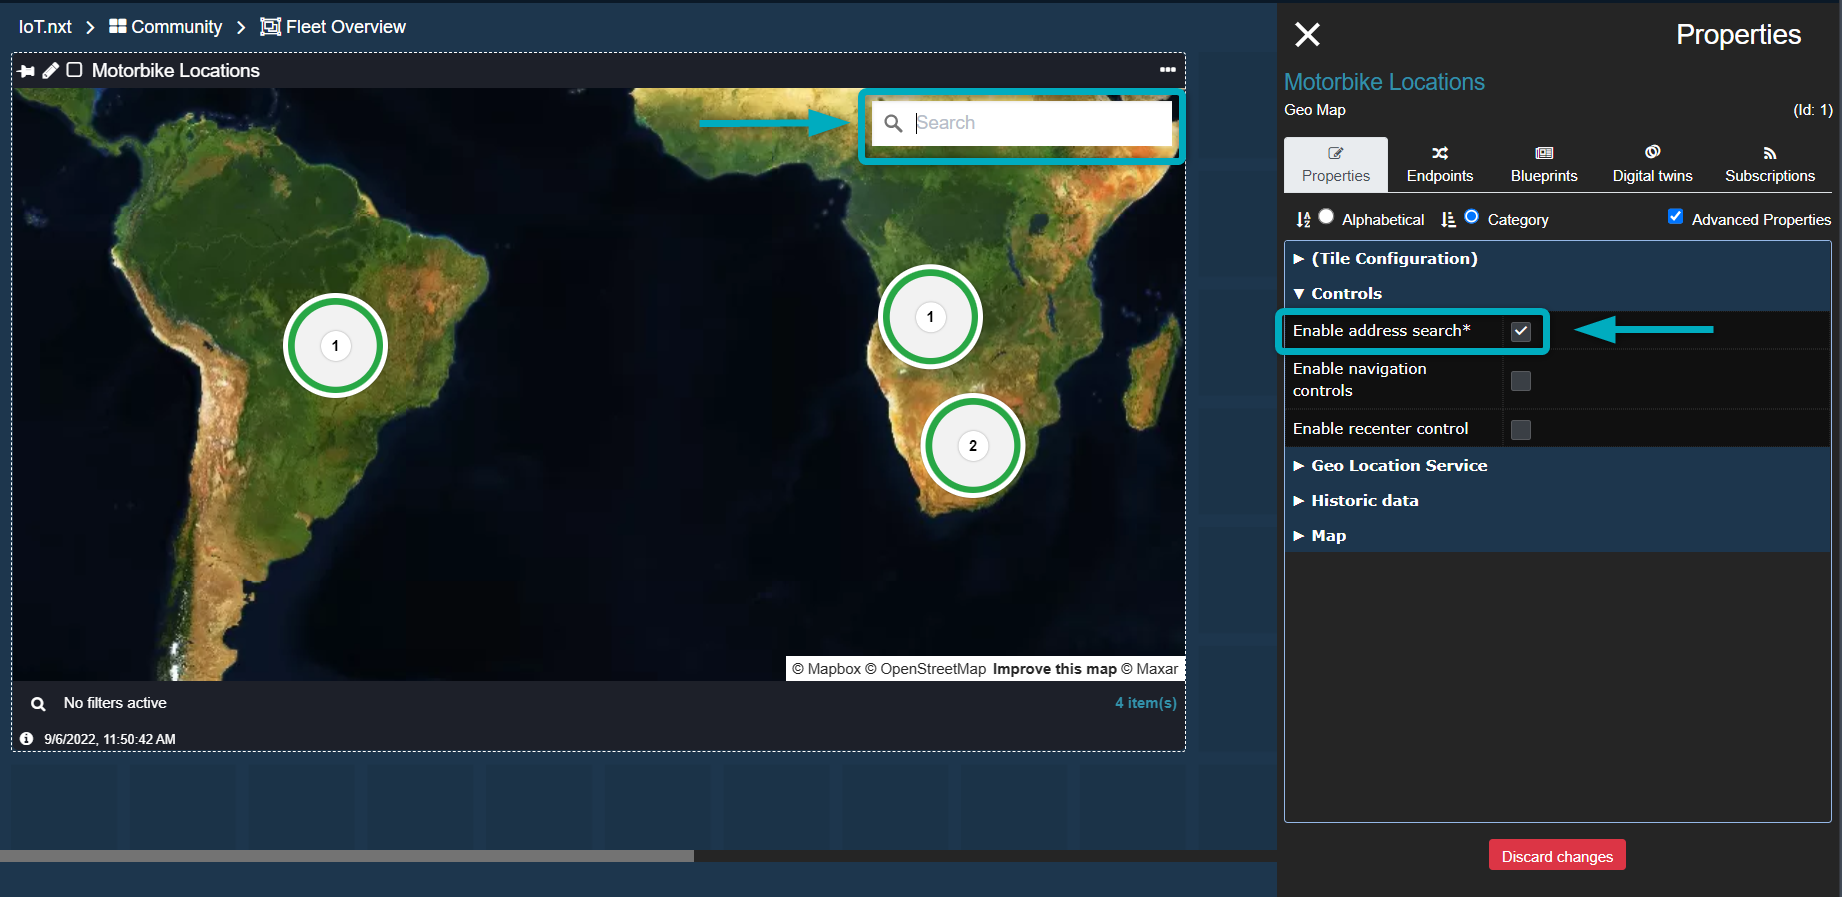
Figure 9 - Controls - address search Enable navigation controls - enable navigation controls in the Geo Map widget.
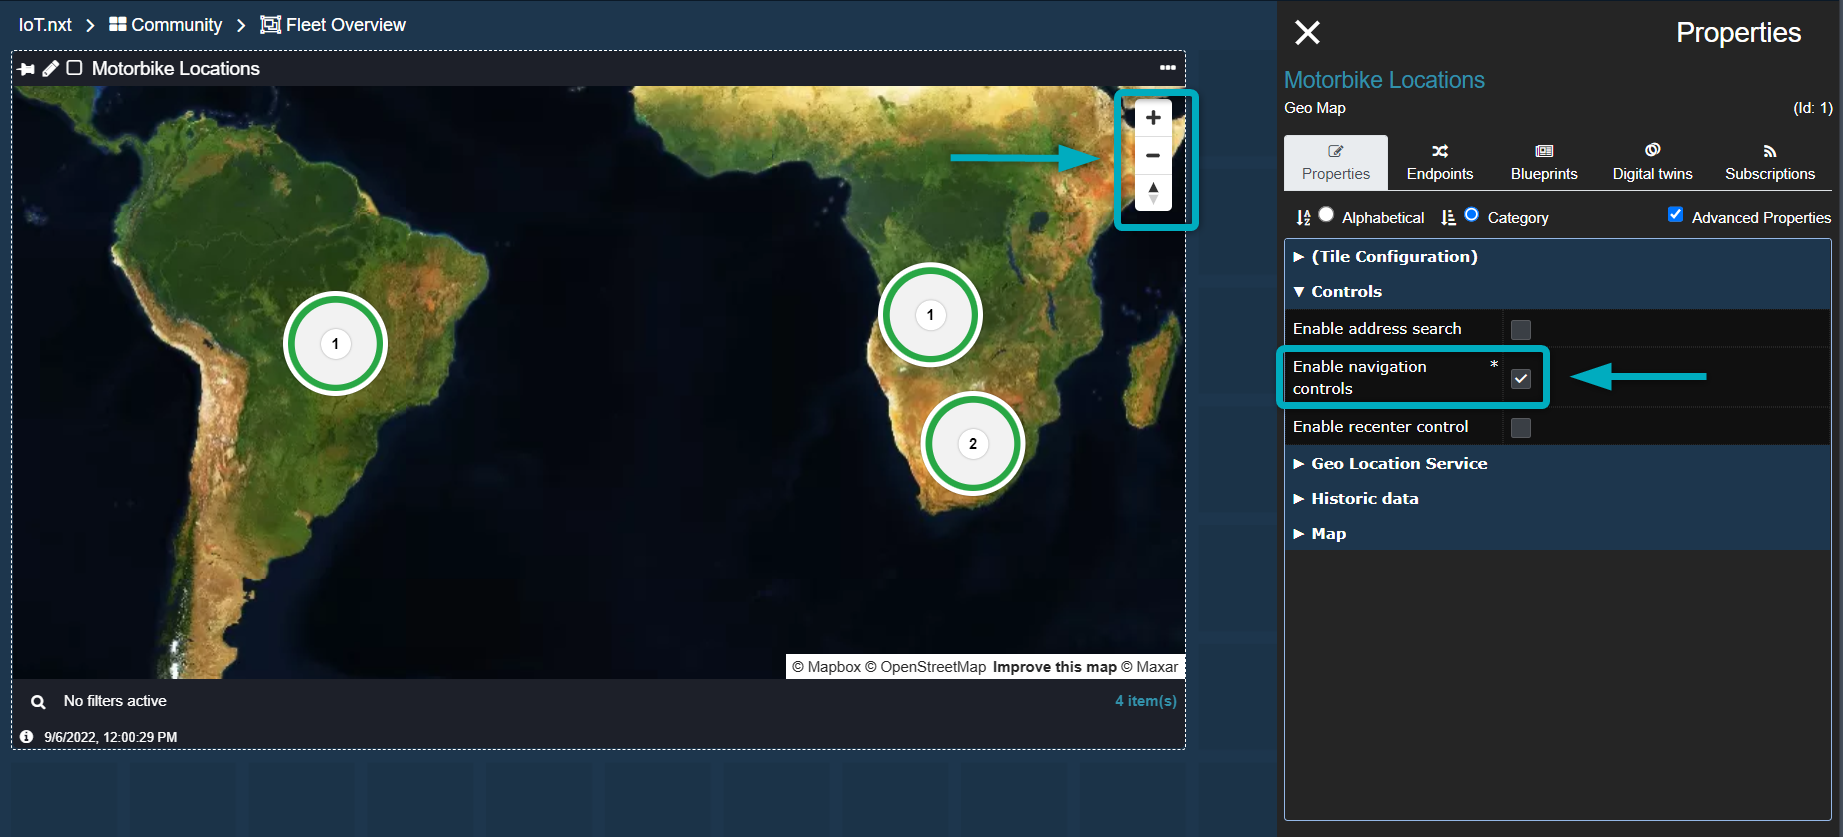
Figure 10 - Controls - navigation controls Enable recenter control - add a button on your Geo Map widget that recenters your map to the present view configuration.
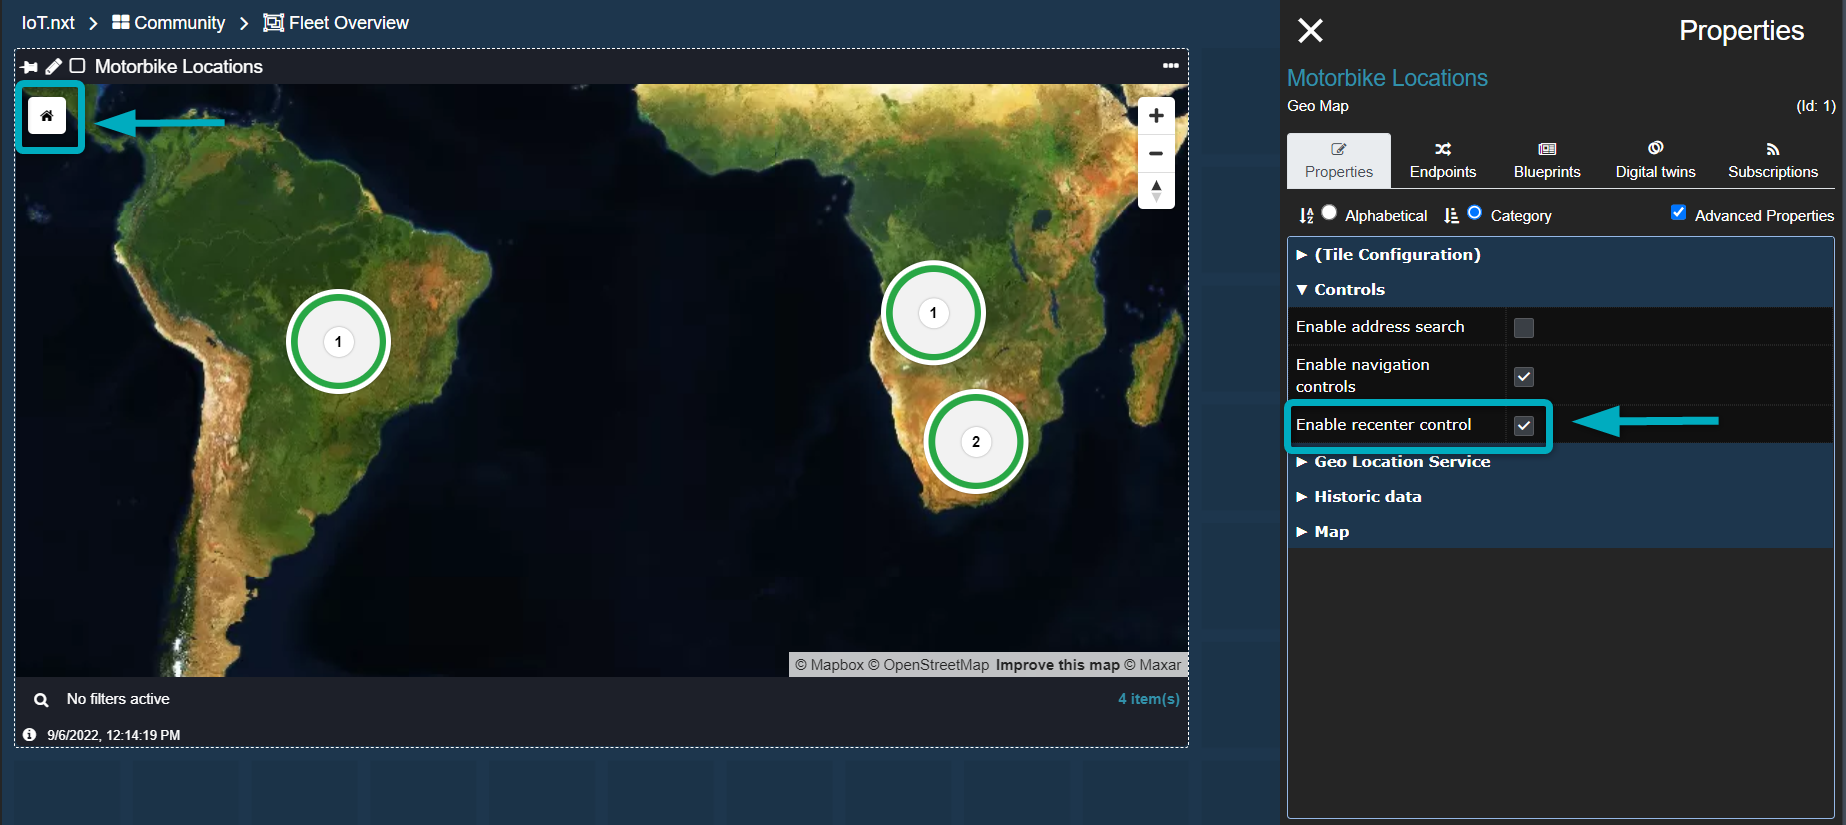
Figure 11 - Controls - recenter control
Geo-location Service (Advanced Properties)
Geo-location Services can be used to link locations to your Geo Map. First create a Geo-location Service in Service Management. Once a Geo-location Service has been created, you can navigate to your Geo Map widget in the Dashboard to configure the service in Geo Map Properties.
- To find out how to set up your Geo-location Service in Service Management click here.
- To find out how to configure your Geo-location Service in Geo Map Properties, click here.
Historic Data (Advanced Properties)
Historic data allows the user to see the history of locations on the Geo Map widget (Figure 30). Once activated, the user can see up to 7 days’ worth of locations for each location on the map.
| This feature cannot be applied if locations are subscribed to the Geo Map with a Geo-location Service. |
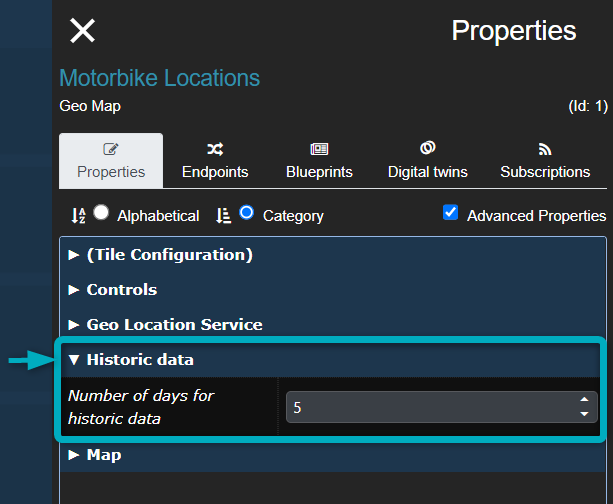
Figure 12 - Historic data
Figure 31 and 32 show a Geo Map widget with Historic Data. Each dot on the map is a data point cached for the location within the specified time frame. If you zoom into the location, you will be able to see an arrow between datapoints, indicating the direction in which the tacked device had been travelling during the selected time frame.
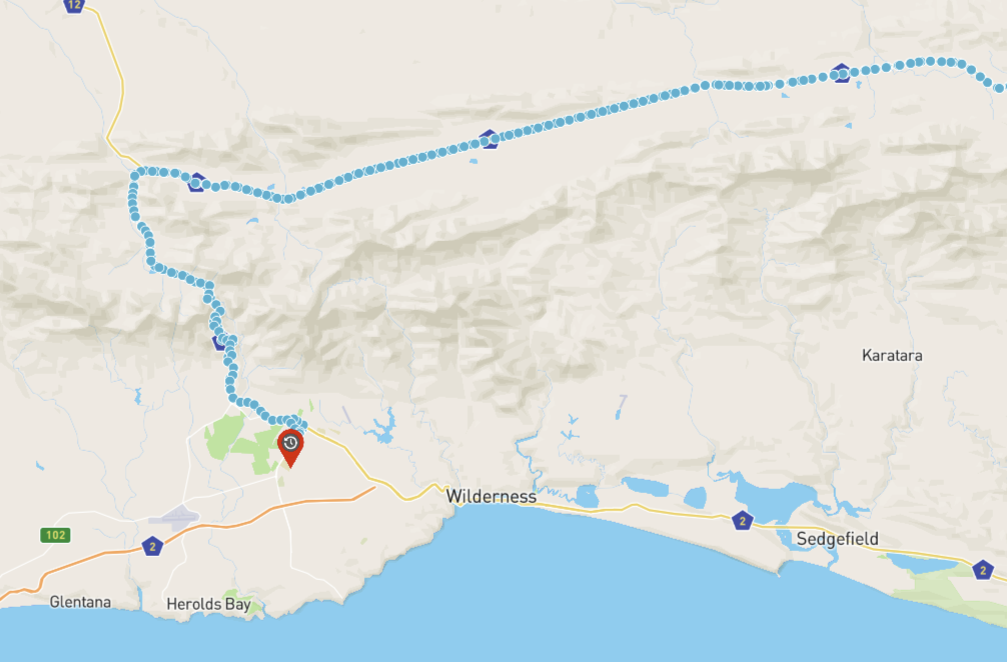
Figure 13 - Historic data - zoomed out
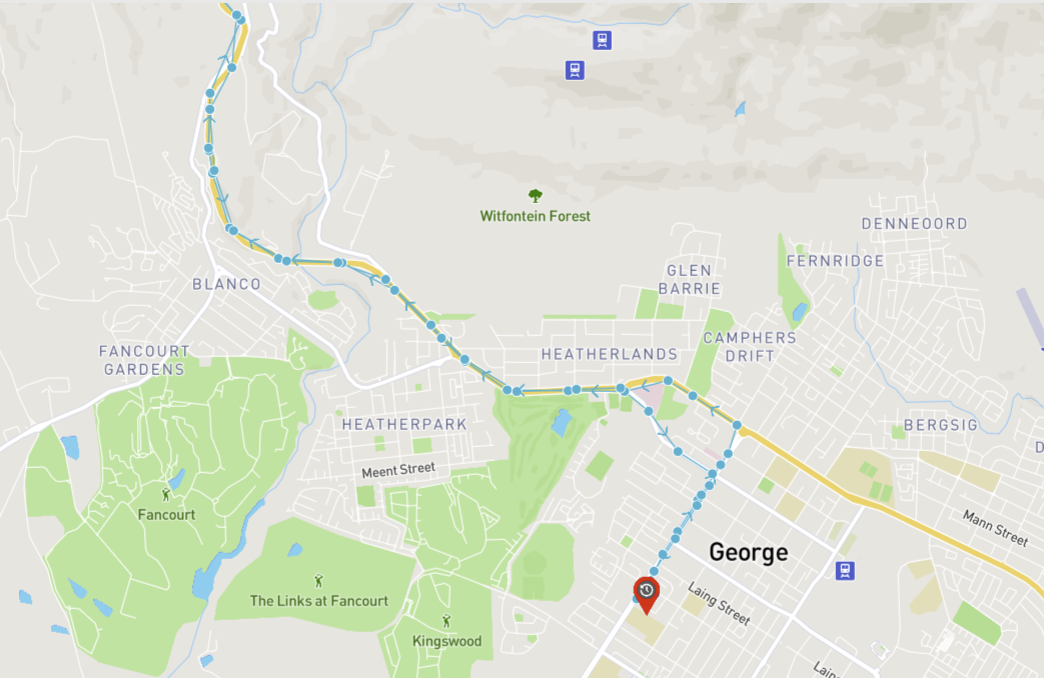
Figure 14 - Historic data - zoomed in (arrows indicating direction)
Map Properties
The Map Properties section of Geo Map Properties allows the user to configure map settings such as panning and zooming, map style and default load map view settings. It also allows the user to configure the Geo Map locations Tooltip Builder (Figure 33).
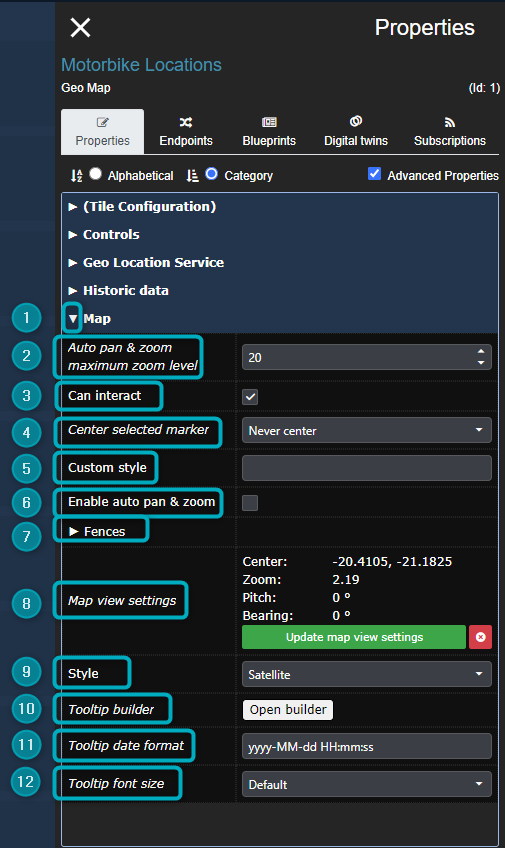
Figure 15 - Map properties - Geo Map Properties grid
Expand - click on the arrow to expand the Map section.
Auto pan & zoom maximum zoom level - set up the zoom level you would like to see when the map loads (the zoom level is limited to a view where all locations are still visible on the map). Level 0 = no zoom; Level 20 = maximum zoom level which includes all sites.
Can interact - enables interacting with the map (zoom in and out, etc).
Center selected marker - choose to never center / always center on a selected marker or center on a selection of markers. The selection will be the map view when it loads.
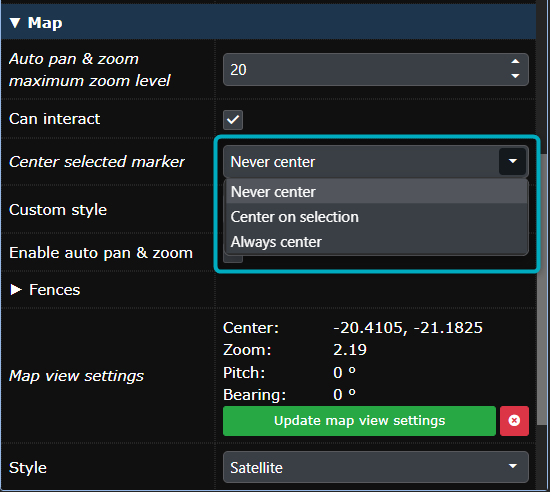
Figure 16 - Center Selected Marker options Custom style - apply a custom style.
Enable auto pan & zoom - automatically zoom into the area that provides a view of all locations (when the map loads). Set your maximum zoom level in Auto pan & zoom maximum zoom level.
Fences - this feature will be active if you have a GeoFence Endpoint in your Entity Tree.
Map view settings - you can manually select a zoomed in area for your map (when the map loads). Zoom in on the area you want to see every time the map loads and click Update map view settings. This will make your selection the default “home” view (if “Enable recenter control” is applied). This setting will also override other configured settings such as Auto pan & maximum zoom level and Center selected marker.
Style - set the style of your map. Options include 1) Basic, 2) Bright, 3) Dark, 4) Satellite, 5) Satellite-streets and 6) Streets, among others. Some examples are shown below:
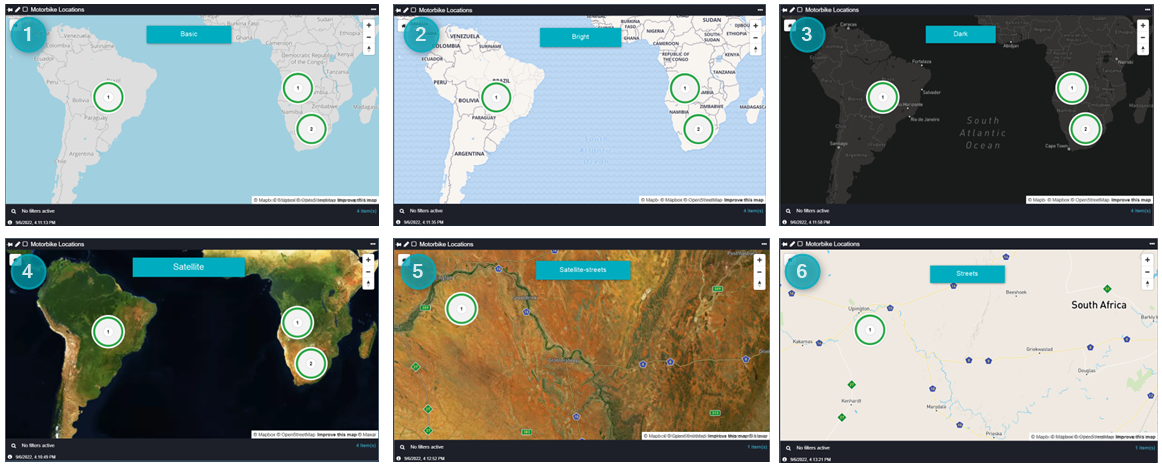
Figure 17 - Map styles Tooltip builder - click on Open builder to configure your Tooltip builder. The information configured in the popup will show on locations in the map when you hover / right click on them.
A Tooltip builder allows the user to configure what data should be visible in location Tooltips. Tags dictate how they look, and the Properties are properties from the linked Geo-location Service, Blueprint and Digital Twin. A different Tooltip template can be built per Blueprint or Digital Twin.
In the Tooltip builder (see the video clip below):
- Select your Blueprint / Digital Twin / Geo-location from the top dropdown.
- Drag the Heading tag into the Enter markdown block.
- Drag the Property you want as your Heading Property (a site name or a License Plate Number, for example) into your Heading box inside the block.
- Provide a Heading name that describes your Heading Property.
- To add content you can drag Content, Unordered list item (creates bulleted lists), Ordered list item (creates numbered lists) or Link (provides a container where you can add a URL) tages into the block under your Heading.
- You can then populate your content with any of the Properties available on the left - drag, drop and name each added Property.
- The Tooltip builder shows a preview of your configured Tooltip on the right.
Tooltip date format - configure the format of the date displayed in your Tooltip.
Tooltip font size - select your font size for the Tooltip (default, small, medium, large).
Clip 4 - Tooltip builder
Once you have configured and Updated (saved) your Tooltip builder information, you can right click on a location to see the configured Tooltip (see Figure 36):
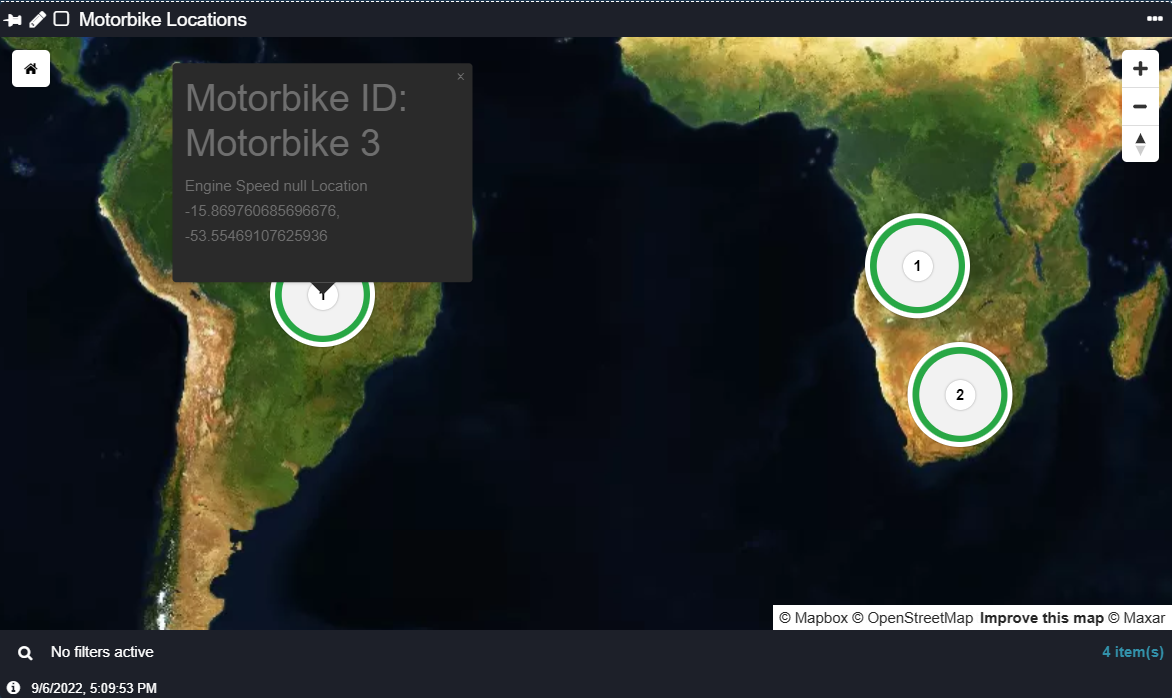
Figure 18 - Geo Map Tooltip (right click on the selected location)
Geo Map Filter
The Geo Map filter can be found at the bottom of the Geo Map widget. If run time filtering is enabled, the Geo Map filter will open, containing an area where filter criteria and its results will display in a table.
Click on the magnifying glass icon to open your filter. The filter table shows your linked / subscribed locations. You can click on the pin icon of individual locations in the filter table to zoom into the selected location on the map. The filter table also shows the last time data was cached for your locations. Click on the magnifying glass icon to close the filter table in your widget.
Clip 5 - Select Location to Zoom In
The filter will show data related to locations that are visible on the Geo Map. Zoom in and out of your Geo Map to filter locations in your filter table:
Clip 6 - Zoom into a location to filter results in filter grid
You can left click on a specific location’s site marker or on the property icon (in the filter table) to view a selected site’s Dashboard (Figure 37):
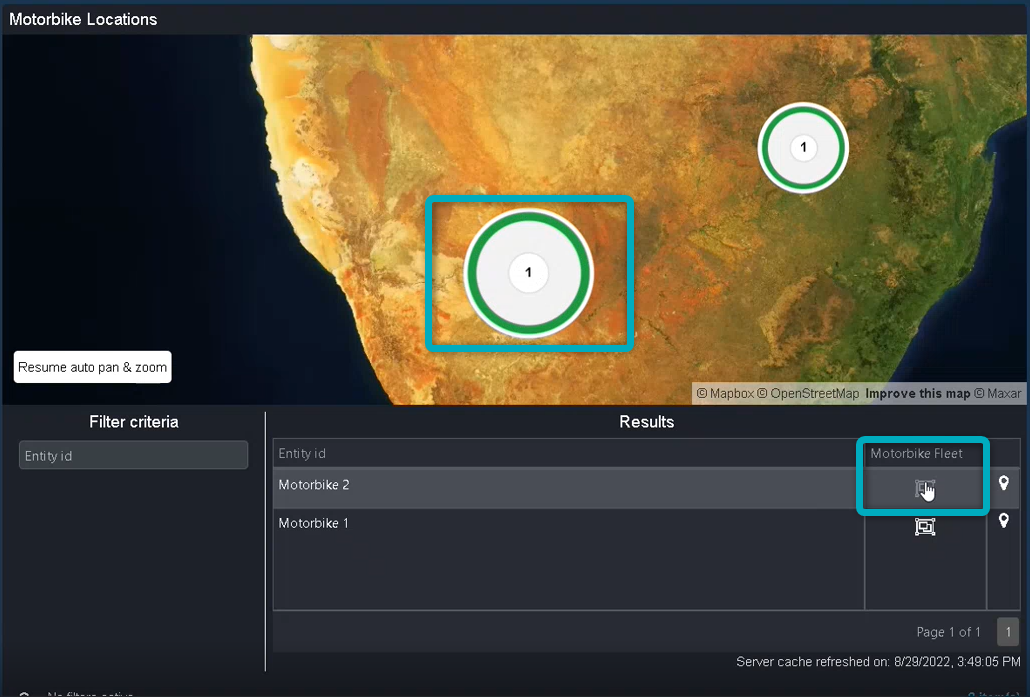
Figure 19 - Select Individual View from Filter
This will take you to the “View Property” that was configured in the Geo-location Service.