
Sonar User Interface
Sep 1 2022 at 12:00 AM
Navigation
The Sonar application is hoted on the Commander™ ecosystem. Users will be able to navigate to the Sonar Application from the Commander™ Landing page via the list of applications permissable to the user:
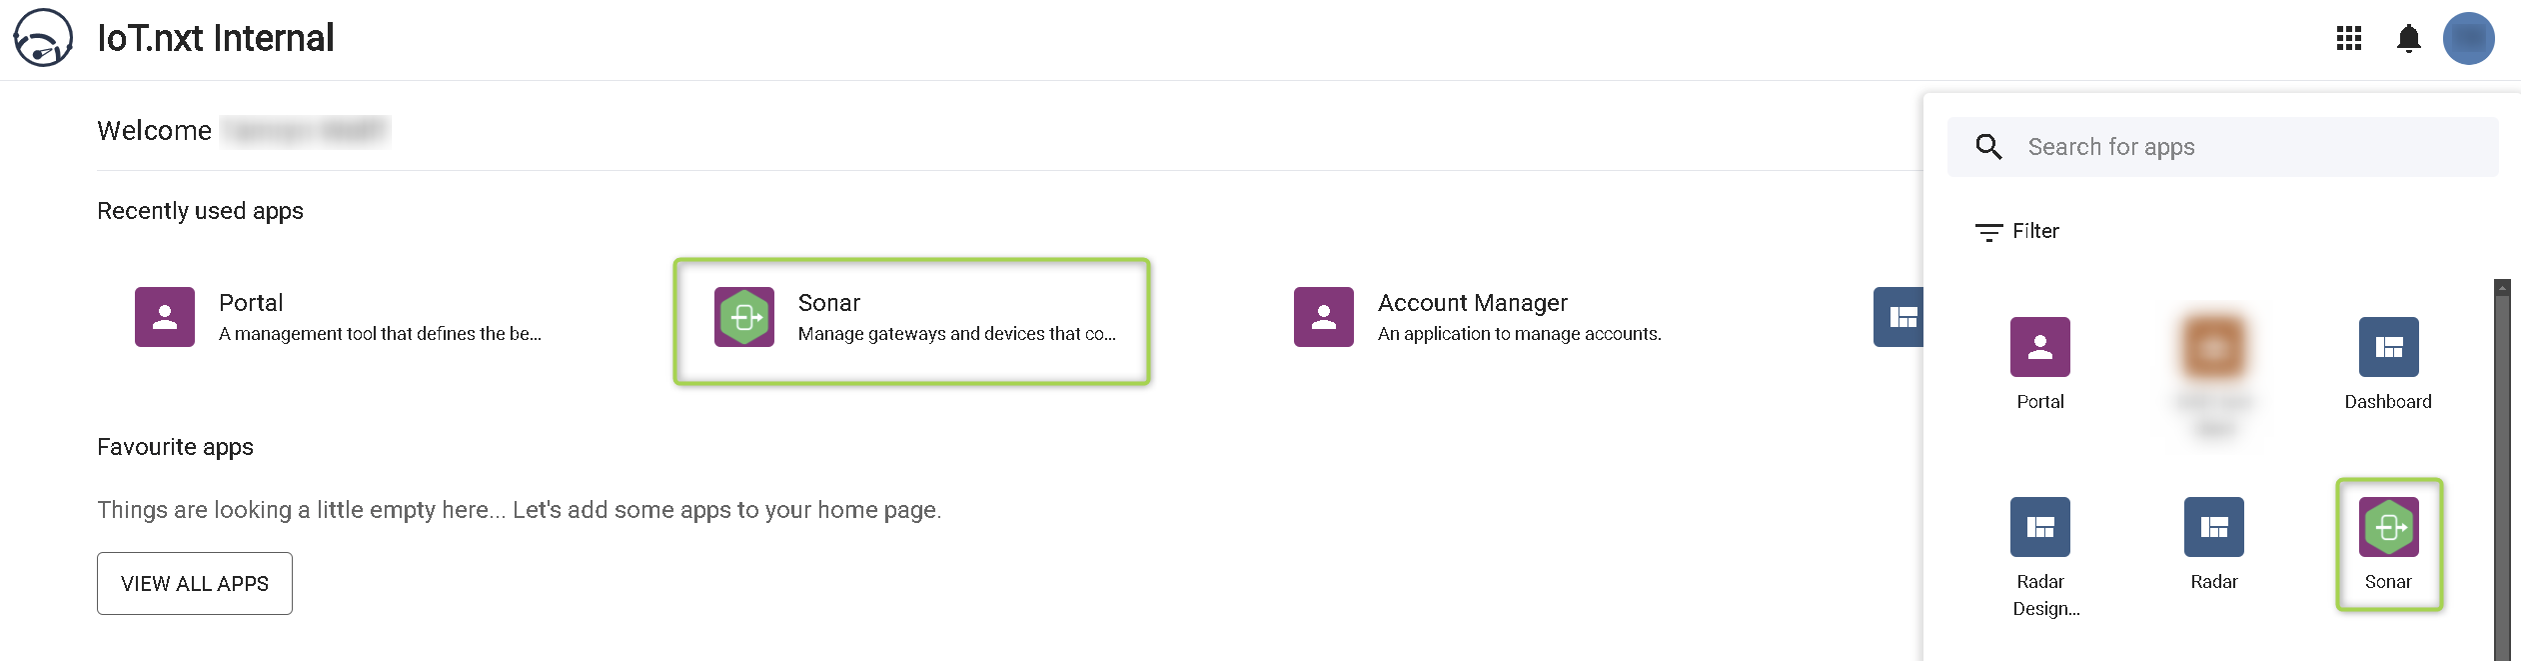
Figure 1 - Commander™ Landing Page
Once Sonar is selected from the Commander™ application list, a new tab will be opened which will take you to Sonar’s landing page (see Figure 2), which displays a list of gateways seen by the Sonar application for the Commander™ tenant or account logged into.
Gateway Health and Connectivity
Gateway Status
With Sonar you will be able to view a list of gateways detected by the V-Raptor™ (that is any gateway or device that has been set up to send data to the V-Raptor™ being assessed). Live gateways will be tagged as Active, gateways that are offline or disconnected will be tagged as Inactive, and finally gateways with an unknown status will be tagged as Unknown. A healthy state is determined by the result of the overall performance of a specific gateway. The state is viewed over a 24 hour period and is updated upon change in result.
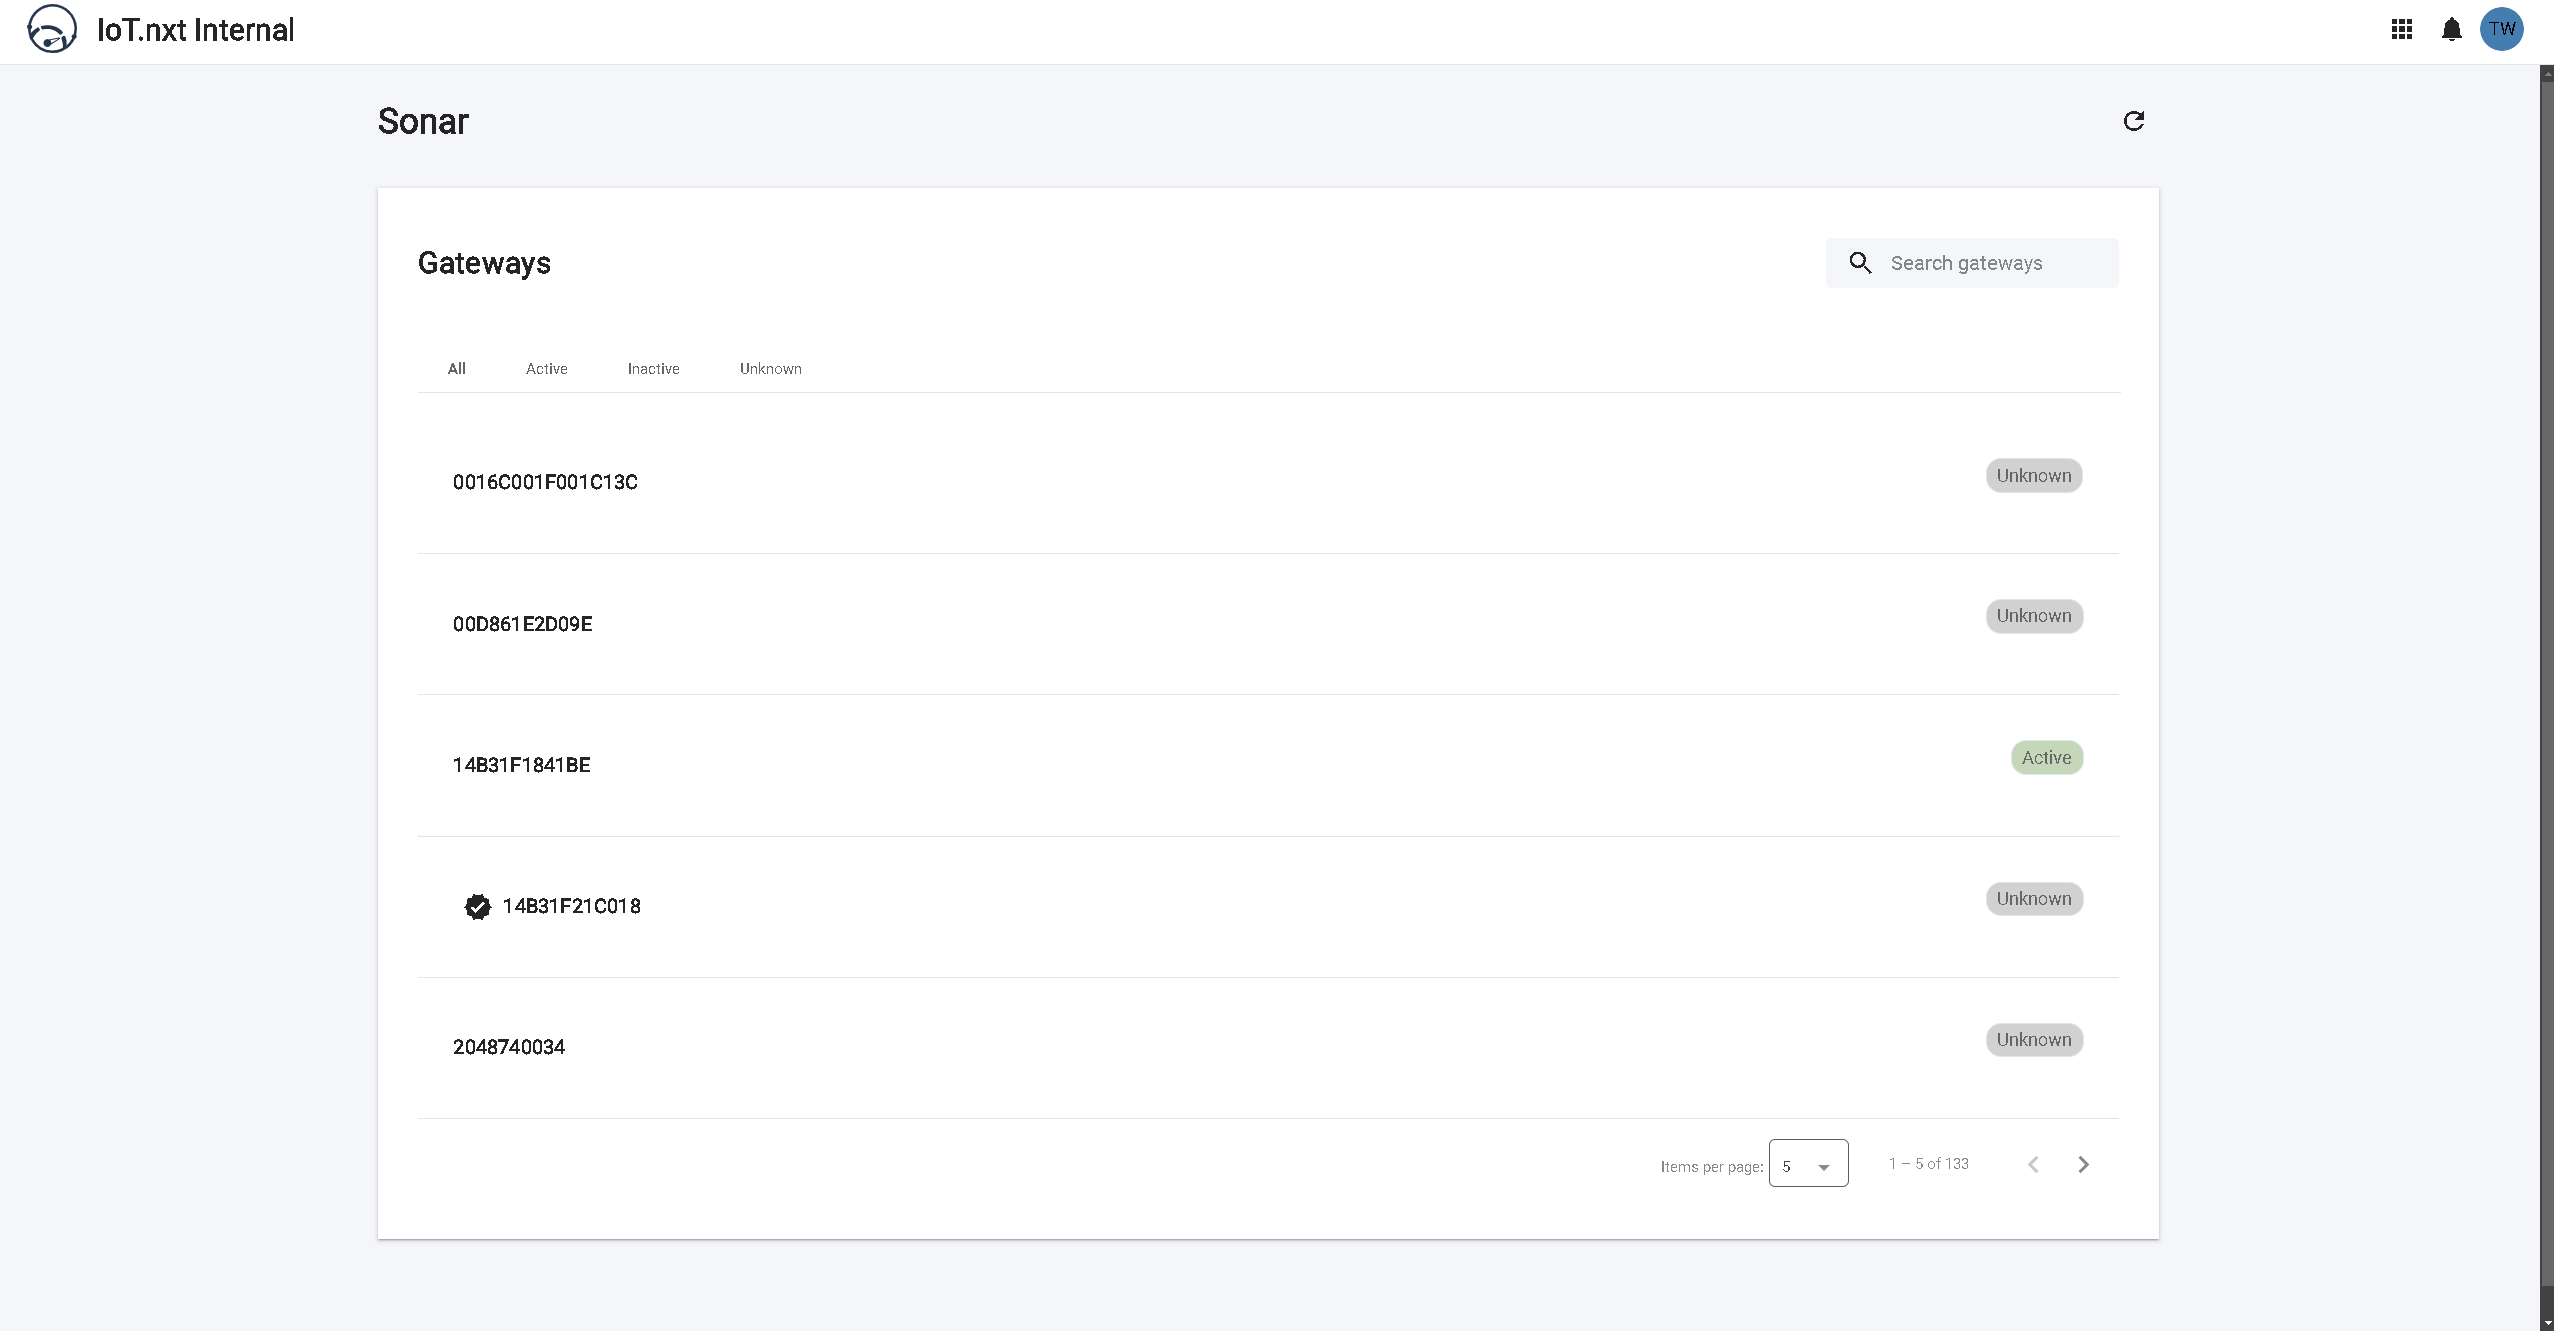
Figure 2 - Sonar Landing Page
Gateway Association
Associated gateways (Gateways that are sending data to the Commander™ platform) are demarcated with a tick mark on the left of the Gateway ID.
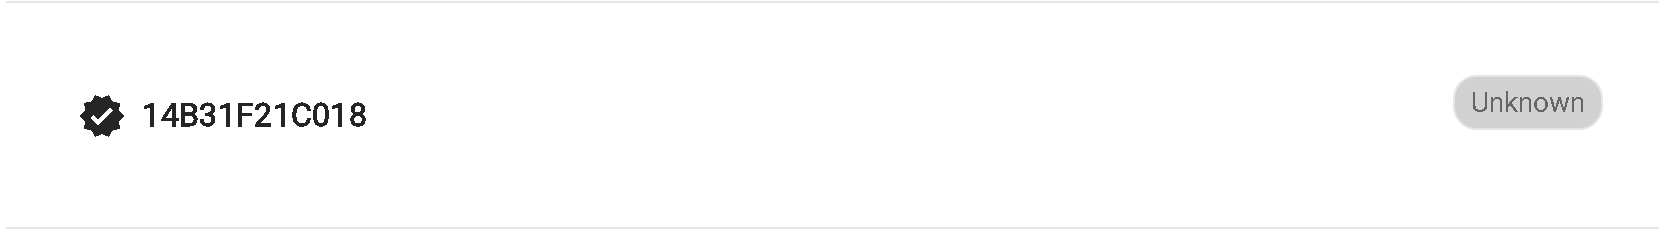
Figure 3 - Associated Gateways
| A gateway that is associated to the Commander™ platform is not necessarily linked to an asset within Commander™, therefore data loss could still occur. Ensure the gateway is associated and linked to avoid lost data. |
Filtering
As per Figure 4 below, a user will be able to filter (i) by the Gateway ID, Gateway friendly name, Healthy Gateways (Active), Unhealthy or Inactive Gateways (Inactive), or by gateways with unknown status (Unknown). They will also be able to easily search for a specific gateway if required by using the “Search gateways” bar (ii) at the top left of the Gateways view box.
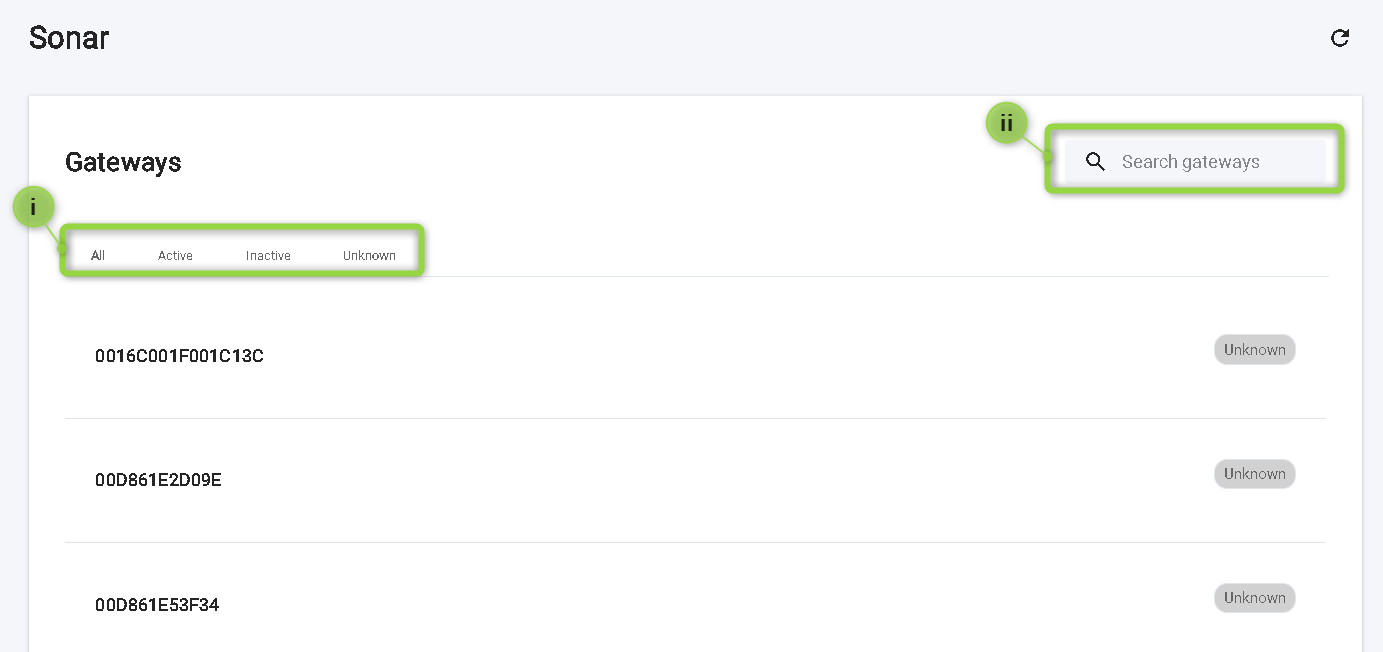
Figure 4 - Filtering options
When using the search bar, the search results will update to show any matches to the input as the gateway ID or name is typed.
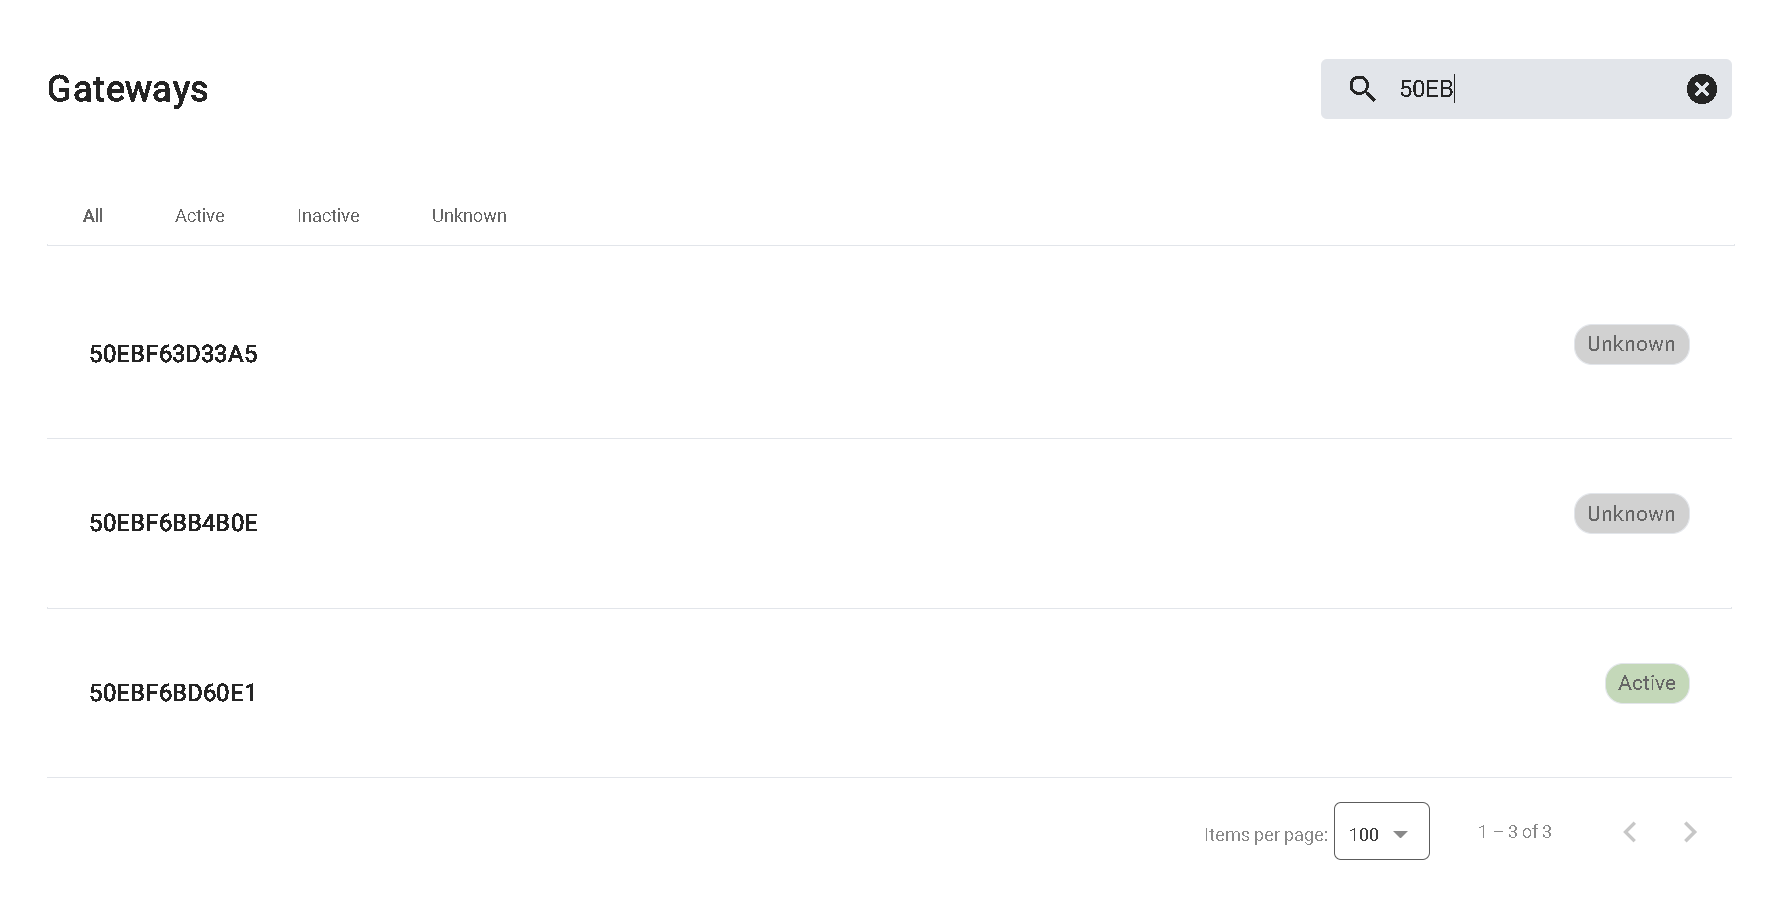
Figure 5 - Filtering results when using the search bar
For a quick view at the last 24 hours of a gateway’s health, hover over the gateway row item to expand the row. A bar showing the connectivity and health of the gateway over the last 24 hours will appear, with an indicator as to when last telemetry was received. The timeline is divided into 30 minute intervals with RAG (Red, Amber and Green) indicators for quick assessment. The statuses translate as follows:
| Green | Gateways is active and healthy |
| Orange | Gateway is active but unhealthy |
| Red | Gateway is offline or disconnected |
| Grey | Gateway is unresponsive, inactive or of unknown status |
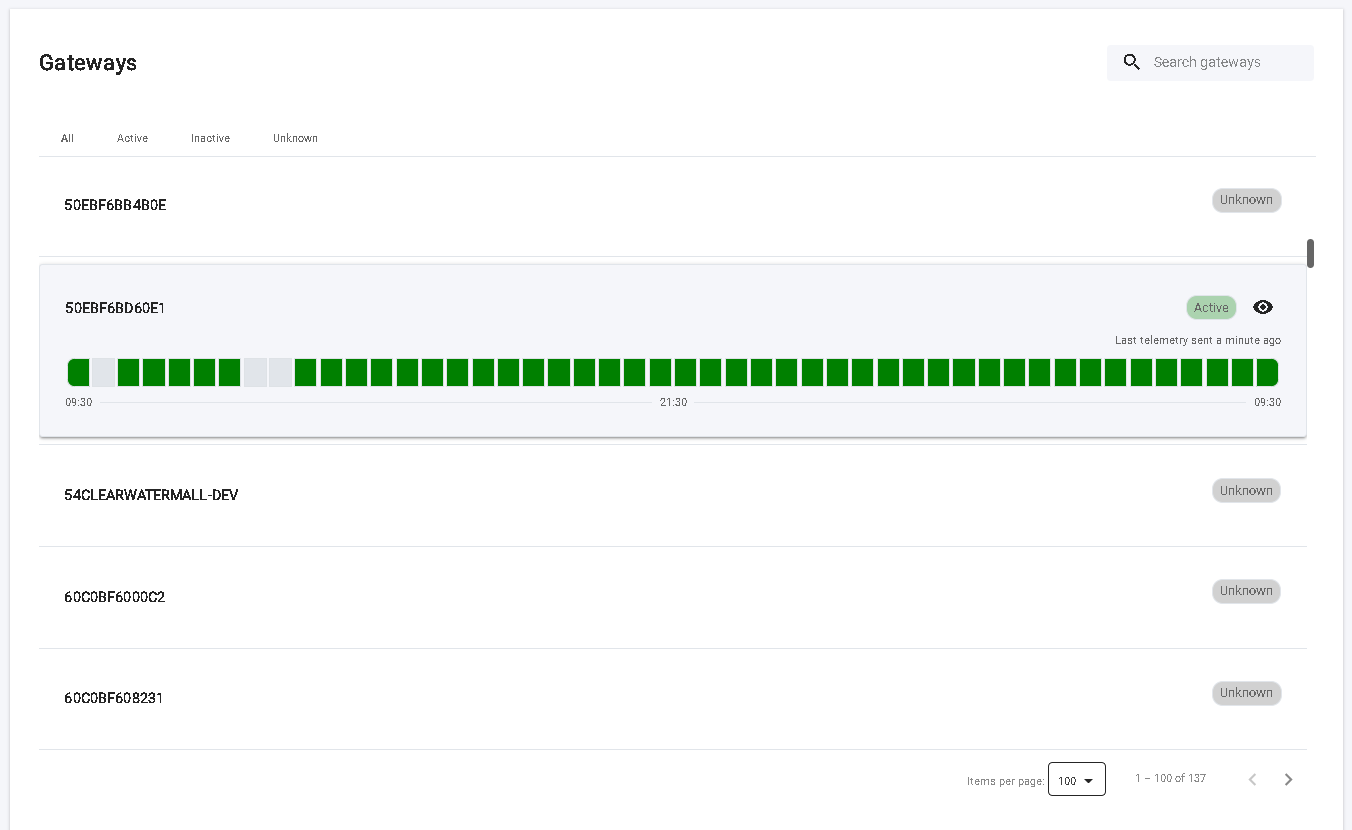
Figure 6 - Gateway Health Timeline (24-hour)
Hovering over one of the 30 minute intervals will display the time frame of that interval, as well as the number of devices both active and inactive.
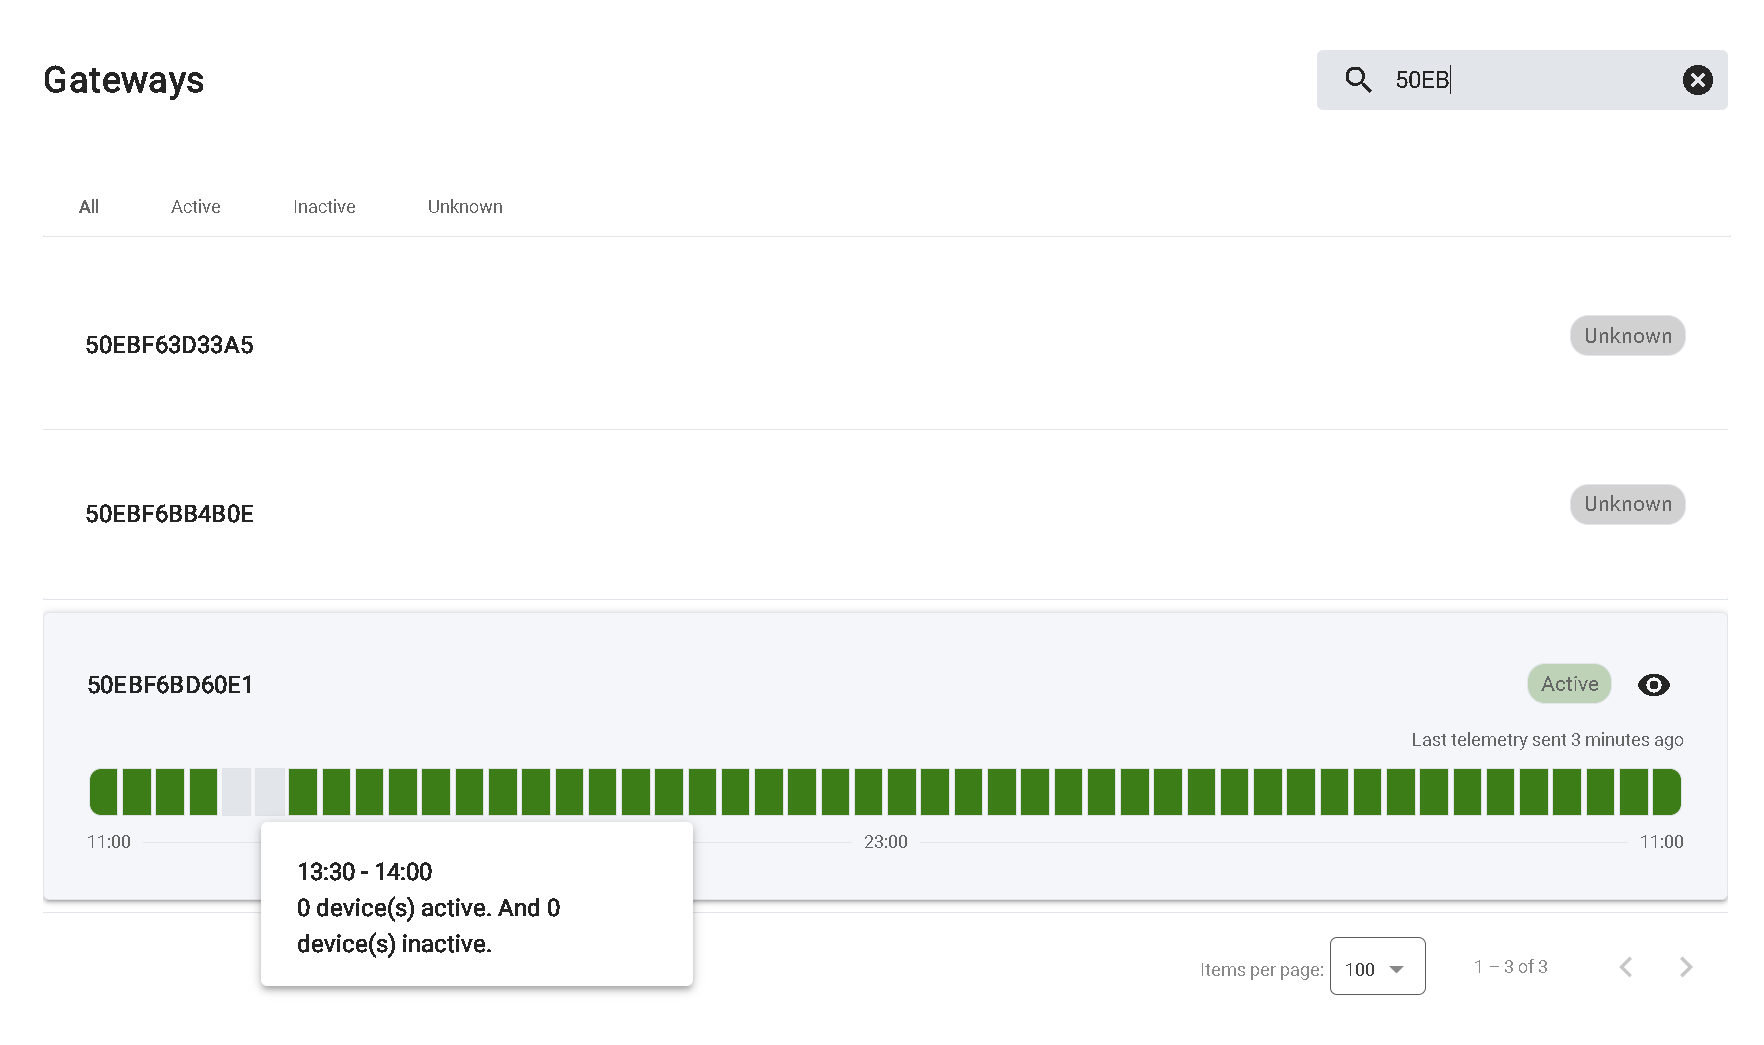
Figure 7 - Hover over an interval on the gateway timeline
Gateway Summary
Hovering over the gateway will also reveal the “View summary” icon (an eye), selecting it will open a right-aligned pop-up window to the gateway list, displaying a more detailed summary of the gateway selected.
The gateway summary details shown are:
- Gateway ID or friendly name,
- Option to drill-down into the gateway ( icon to the right of the gateway name),
- Snapshot history (24 hour timeline),
- Status,
- Gateway details;
- Make,
- Model,
- Registration,
- Last telemetry sent,
- Linked parent gateway,
- Linked children gateway (if available).
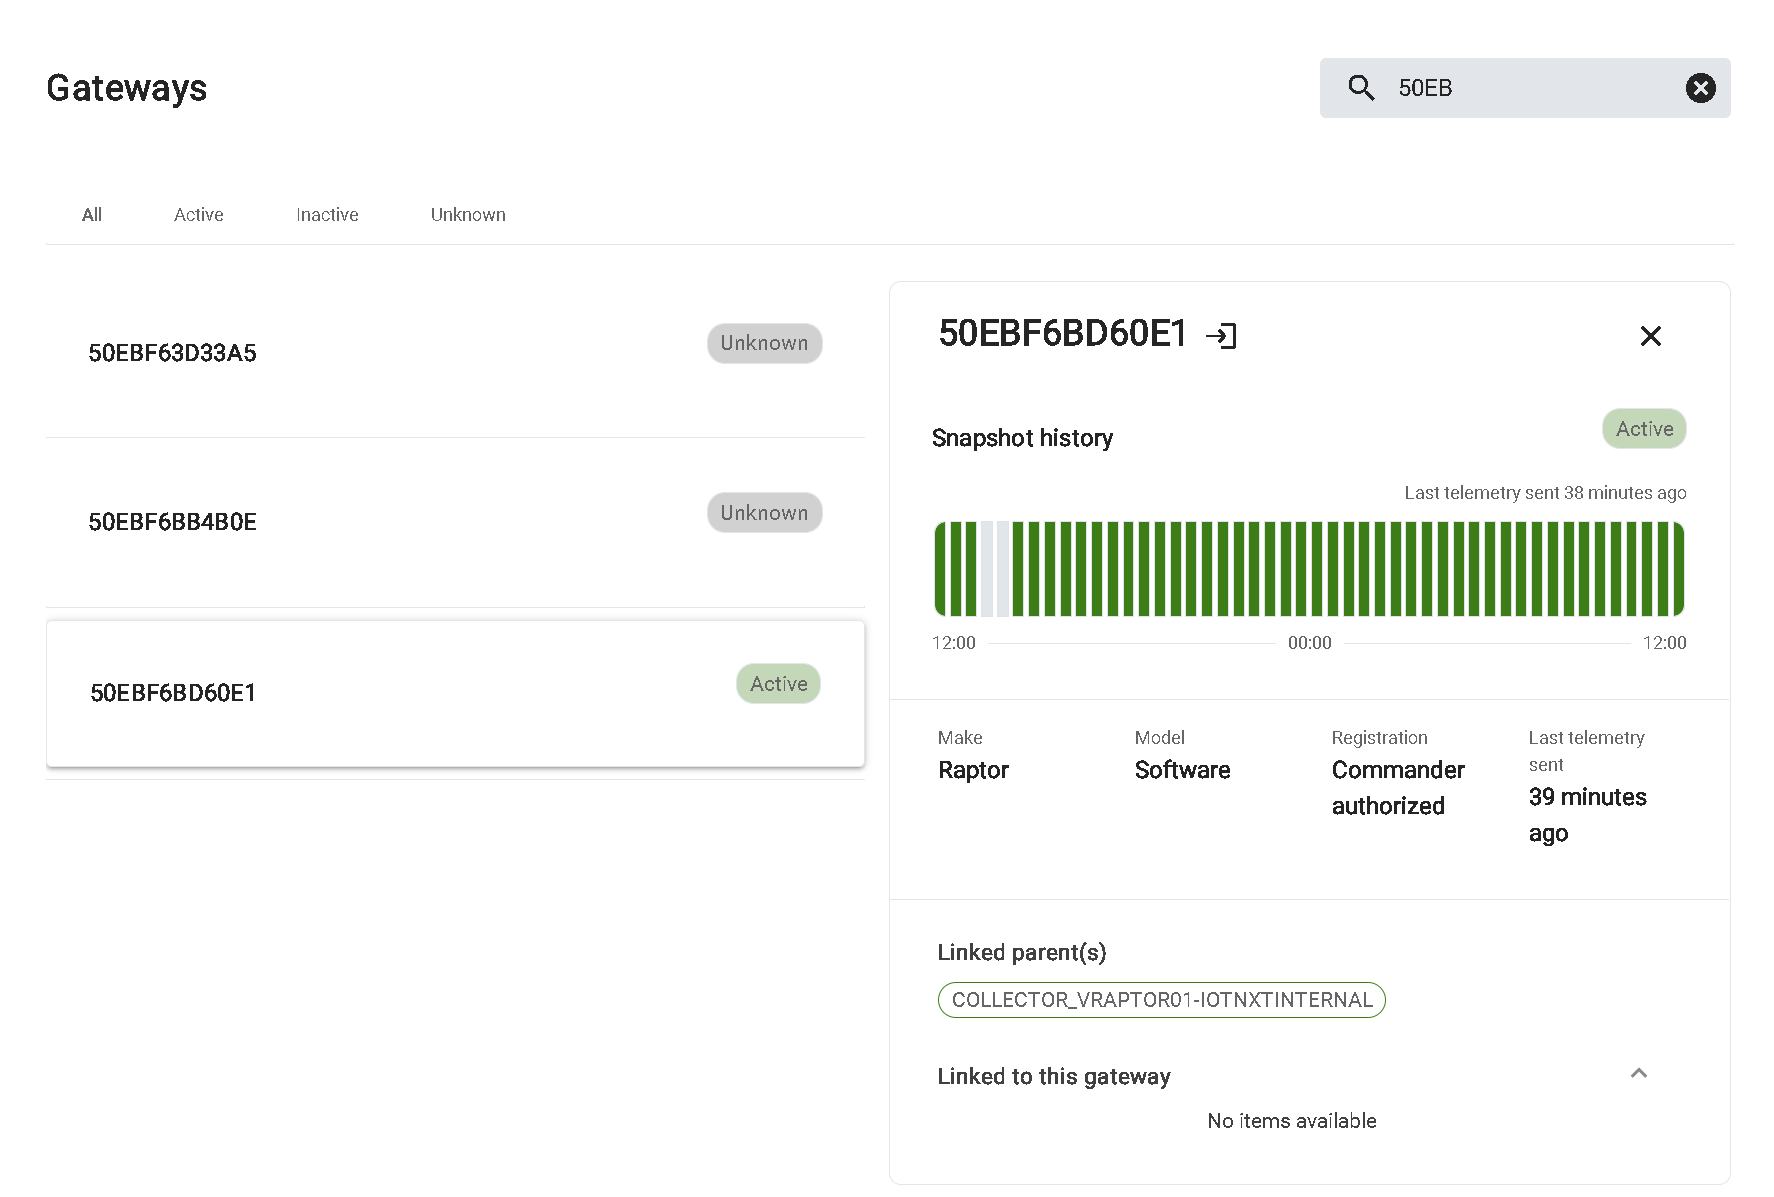
Figure 8 - View the selected gateway's quick summary
Gateway Drill-Down
Selecting the gateway row item (clicking anywhere except on the summary eye icon) will navigate to a drill-down view of the gateway selected. This screen will display the gateway selected’s name in the top left of the screen, as well as an Overview of the gateway, devices connected to the gateway, and an Event Log for the gateway. What to expect for each of these tabs:
Gateway Overview Tab
Summarises key information about the gateway (the same as the Summary View on the V-Raptor™ Sonar landing page):
- Gateway status,
- Status history (24 hour timeline),
- Last telemetry sent,
- Make,
- Model,
- Registration,
- Linked parent gateway,
- Linked children gateway.
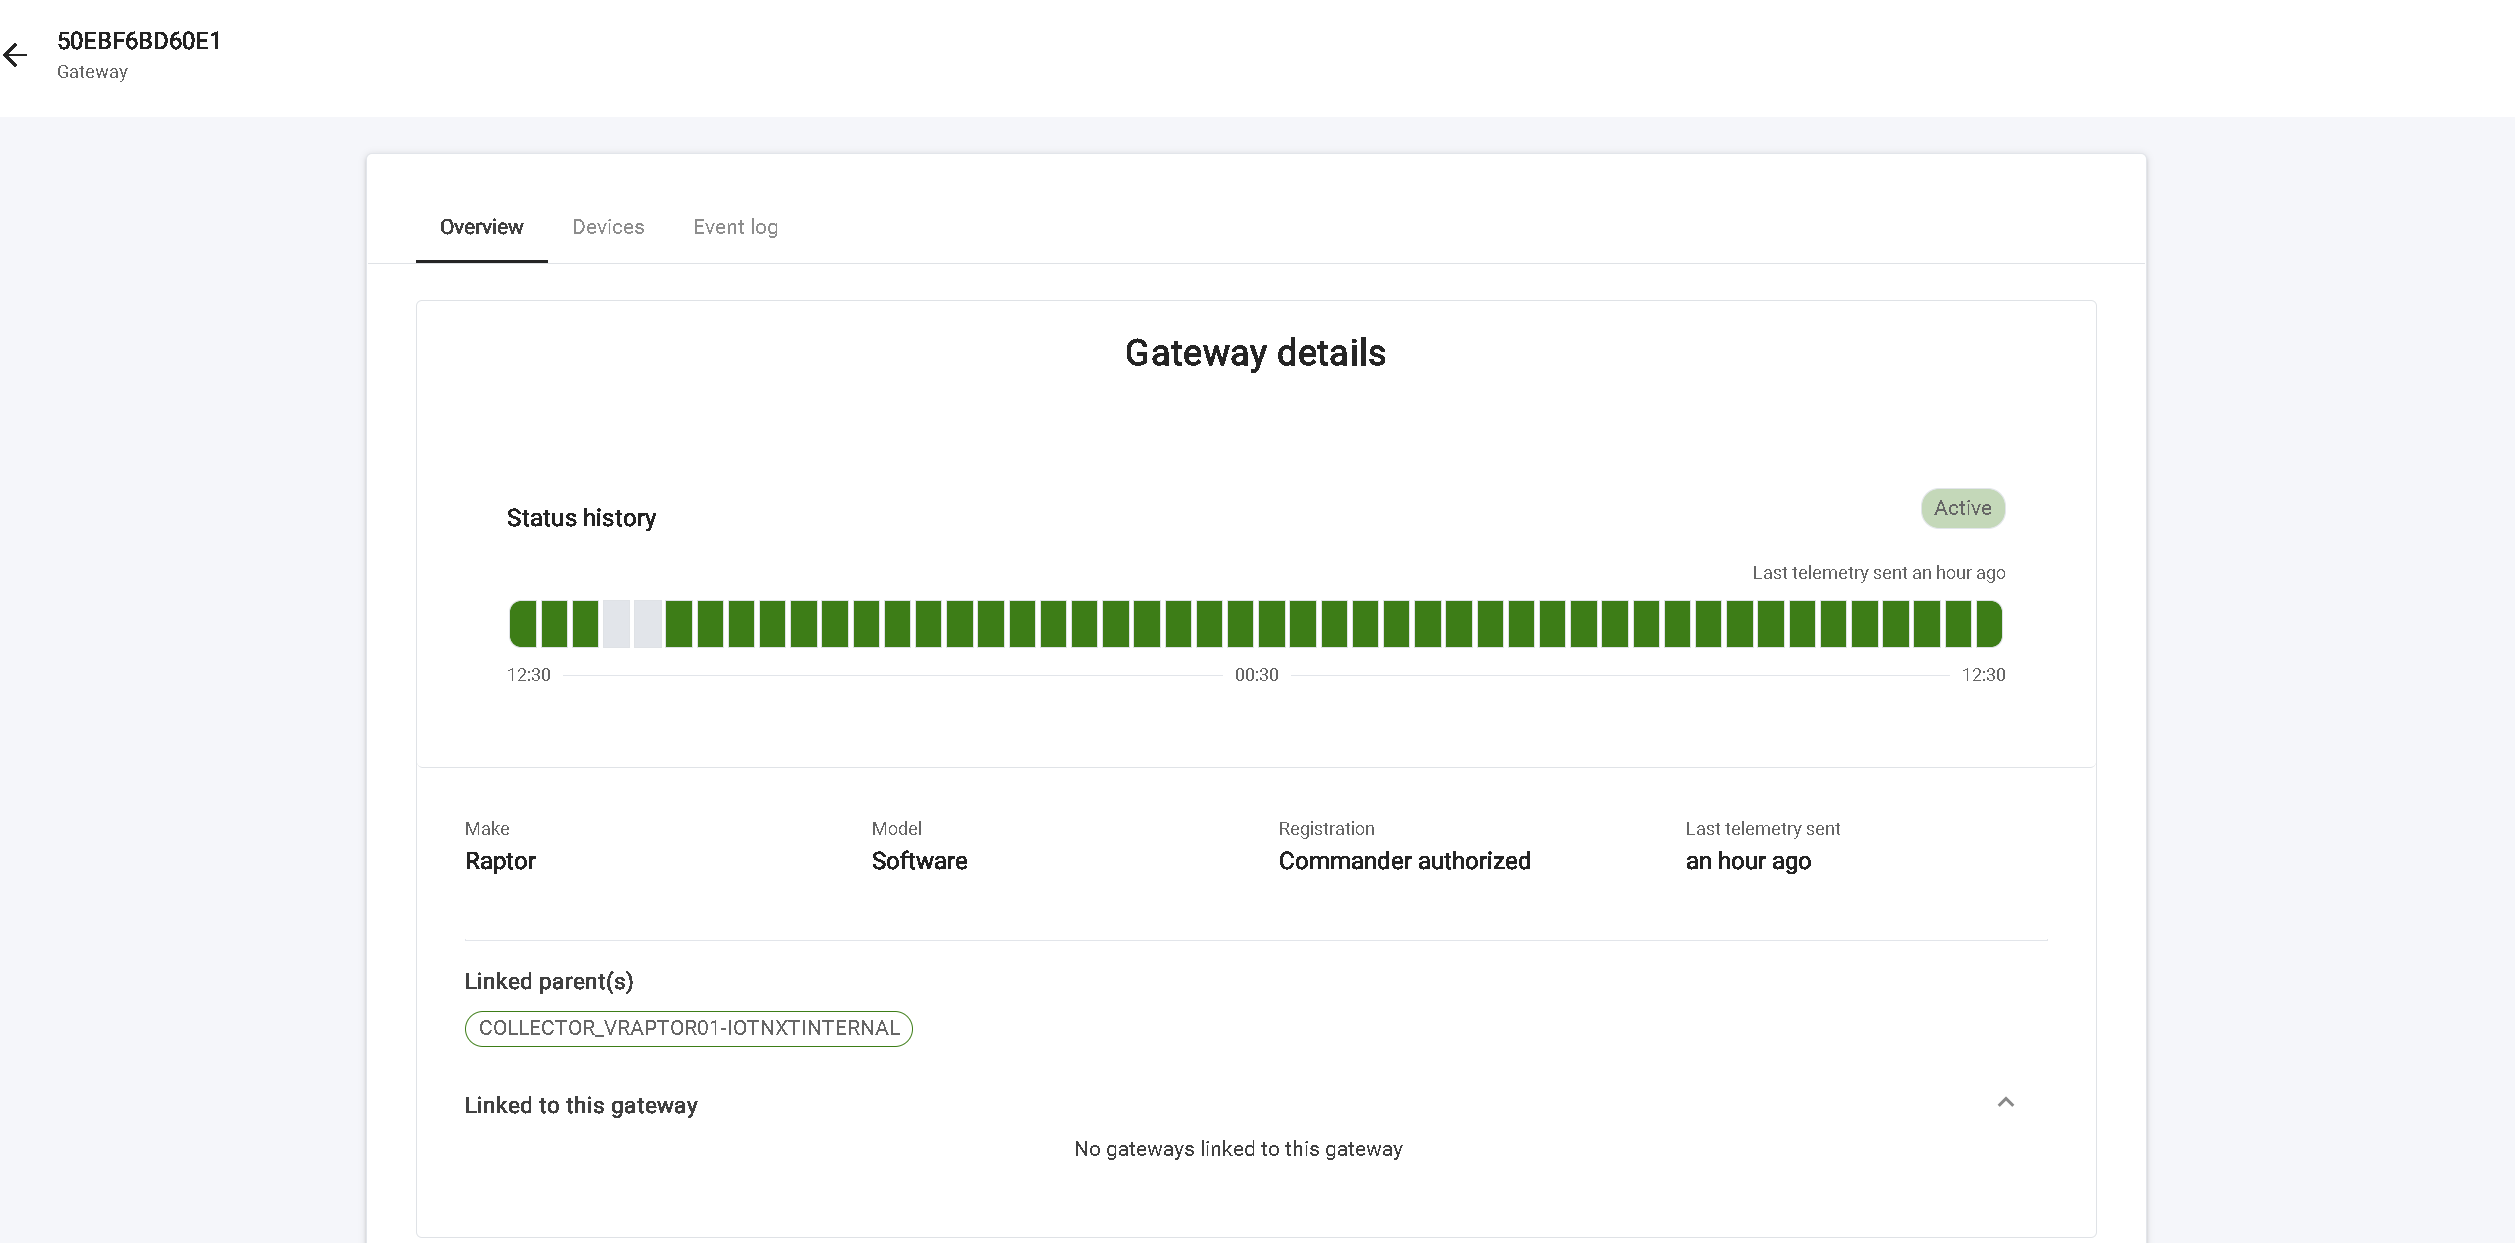
Figure 9 - Gateway Overview
Gateway Devices Tab
The devices tab shows a list of devices connected to the gateway being assessed. This offers a similar user interface to the gateway list view on the Sonar landing page, where the status of the device can be viewed (Active, Inactive, Unknown) and when hovering over the row item, a 24-hour timeline is revealed with that specific device’s connectivity and health history. This row item can be selected to drill-down even further into the gateway, as discussed in later in this document.
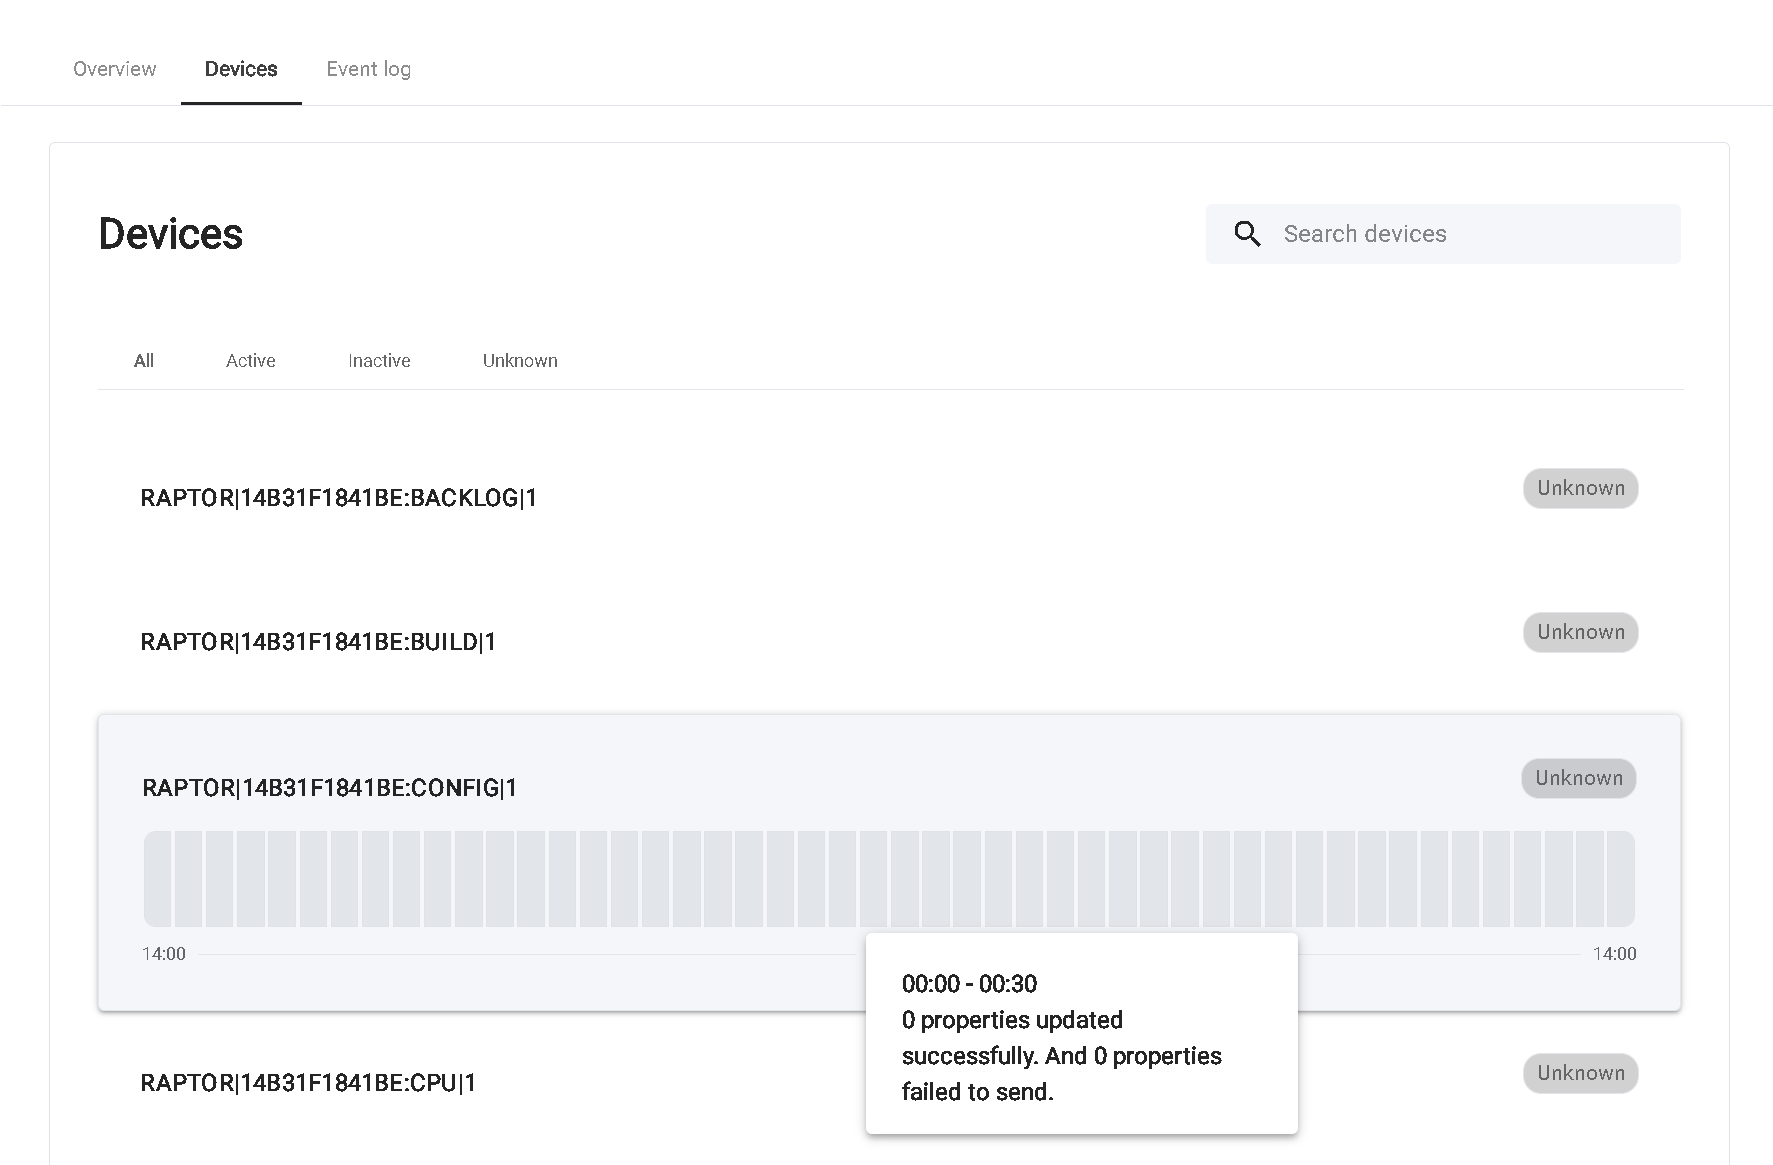
Figure 10 - Gateway Devices
Gateway Event Log Tab
The event log lists key occurrences for the selected gateway. This could include a disconnection, a planned downtime session for maintenance, or when the gateway connected or reconnected. Each event log row will contain a description of the event, as well as include the date and time the event occurred. In the case of no events, the log will be blank.
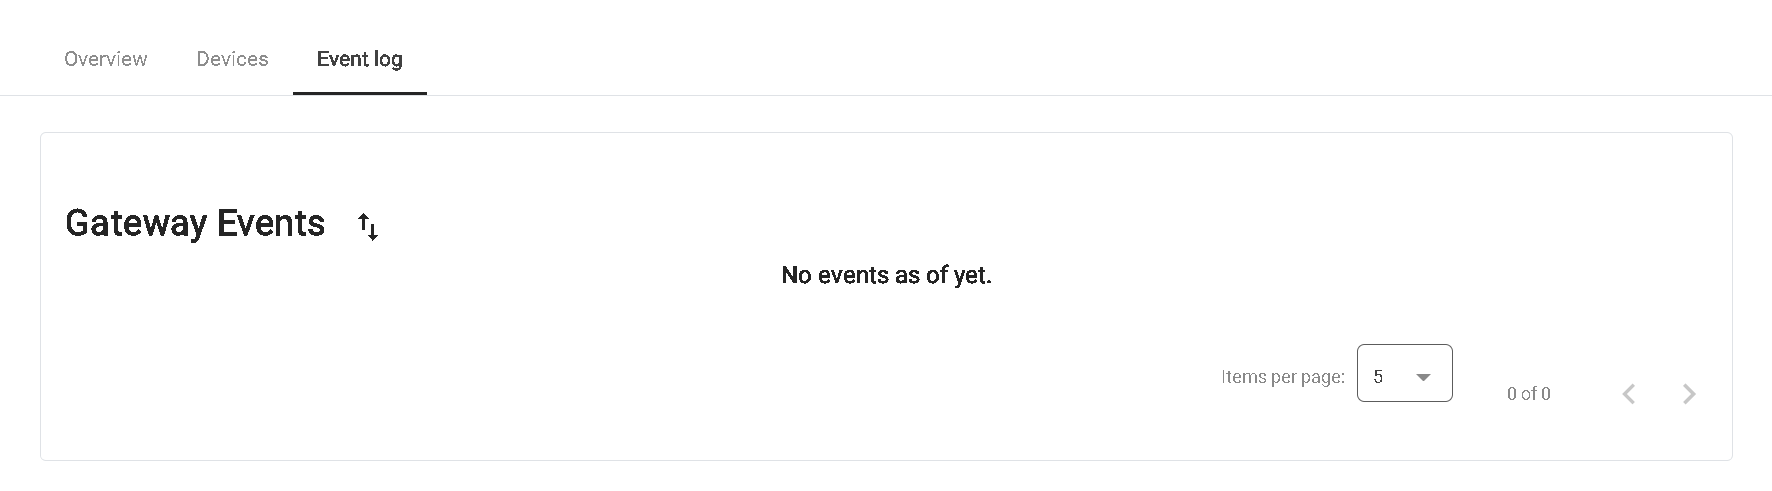
Figure 11 - Gateway Event Log
Devices Drill-Down
Selecting the device row item will navigate to a drill-down view of the device selected. The top left of the screen will display the breadcrumbs for the navigation performed (Gateway name > Device Name). This information block will display an overview of the device, properties of the device, an event log for the device, and driver information. What to expect for each of these tabs:
Device Overview Tab
Summarises key information about the device (the same as the Summary View on the gateway devices window):
- Device connection details (status);
- Last connected,
- Status,
- Status history;
- 24 hour timeline,
- Last reconnect,
- Last status sent,
- Total uptime,
- Total reconnects (graph: time vs reconnects).
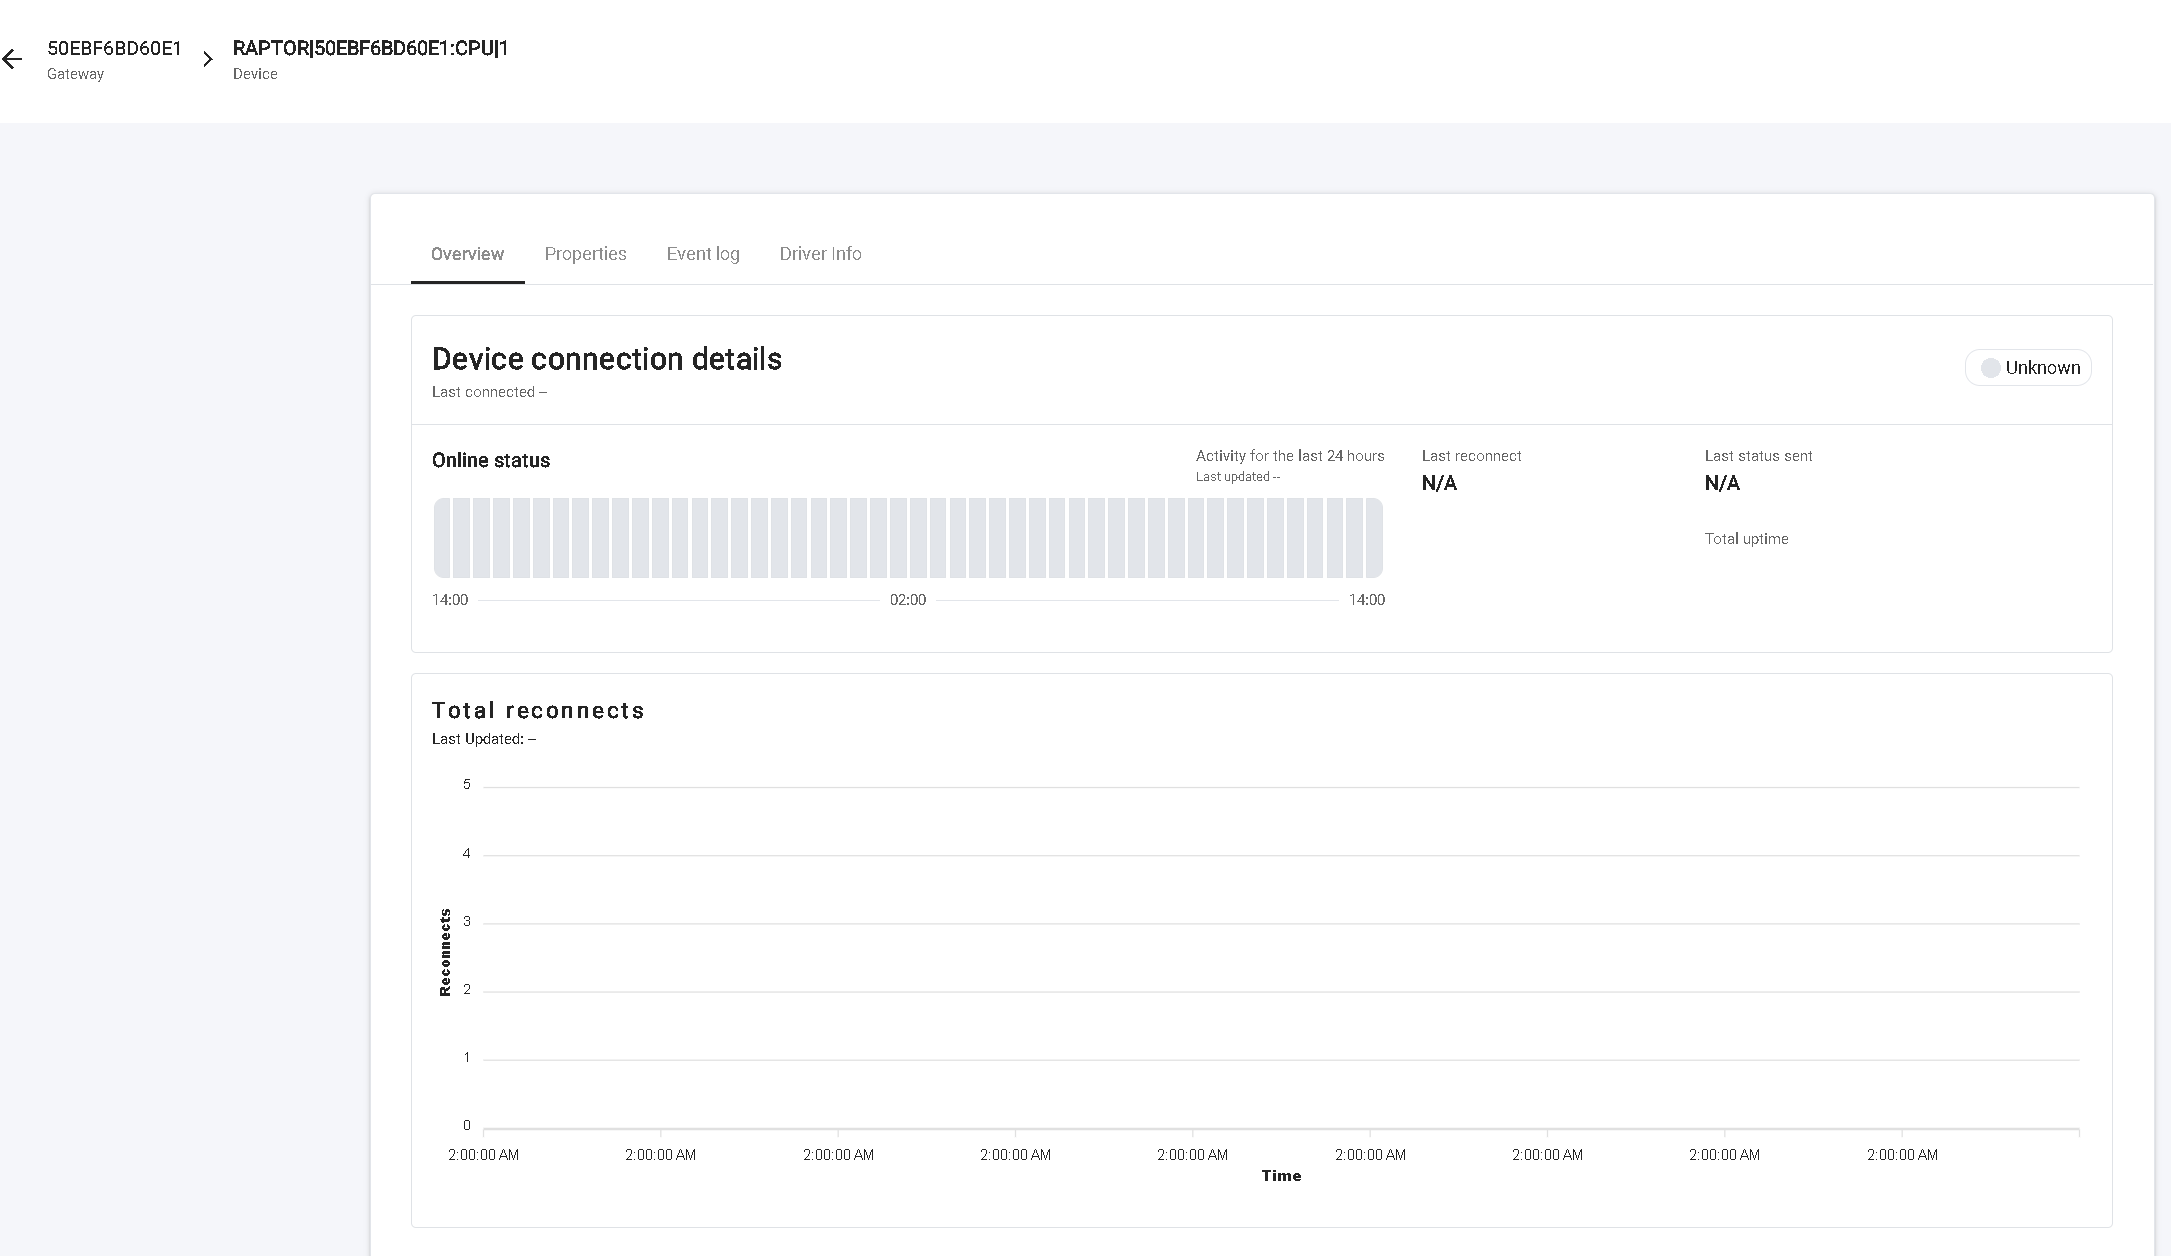
Figure 12 - Gateway Device Overview
Device Properties Tab
The device properties tab shows the overall health of the properties from the selected device. Any properties that may have abnormal patterns will be flagged here, and any properties that have failed will be listed.
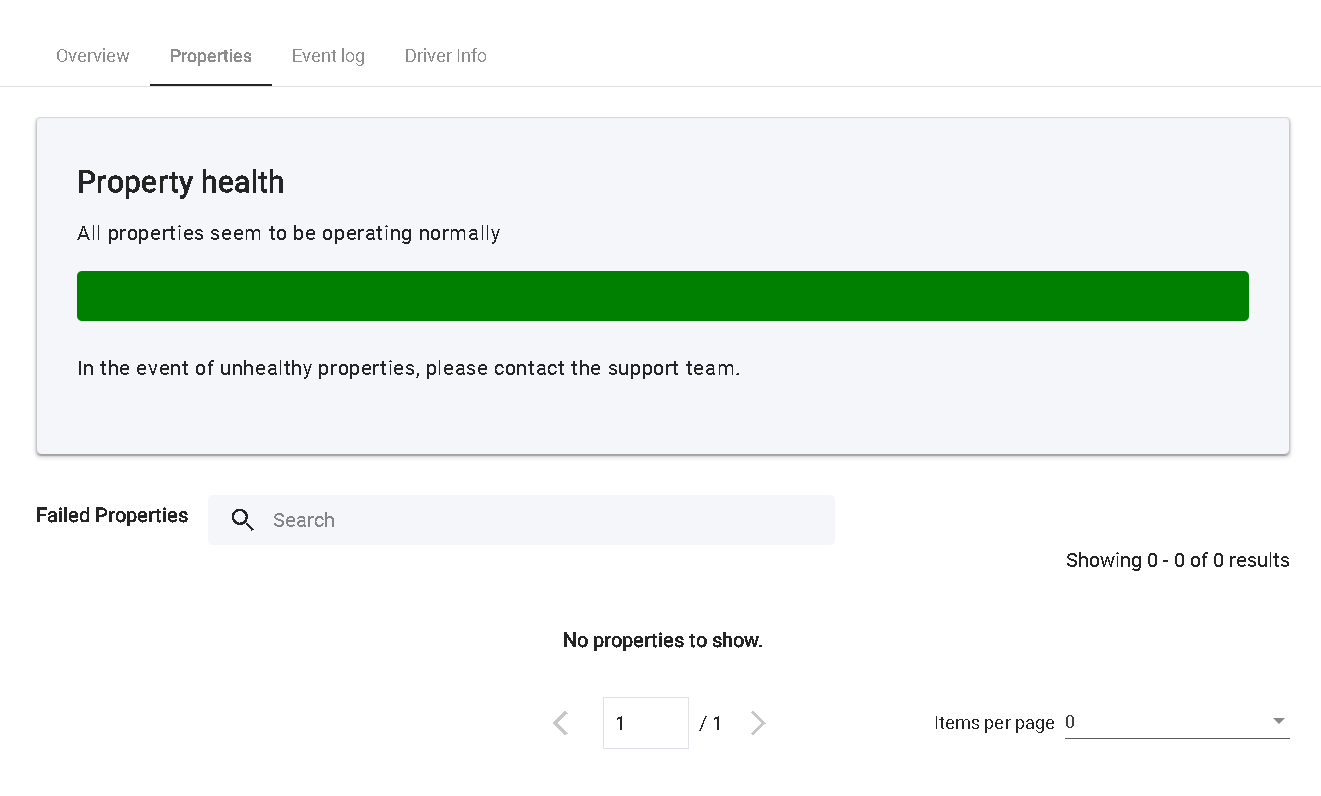
Figure 13 - Gateway Device Properties
Device Event Log
The device event log lists key occurrences for the selected device. This could include a general disconnection, an issue with a specific property within the device, or if the device or a property in the device becomes healthy again or reconnects. Each event log row will contain a description of the event, as well as include the date and time the event occurred.
In the case of no events, the log will be blank and the window will show “No events as of yet”.
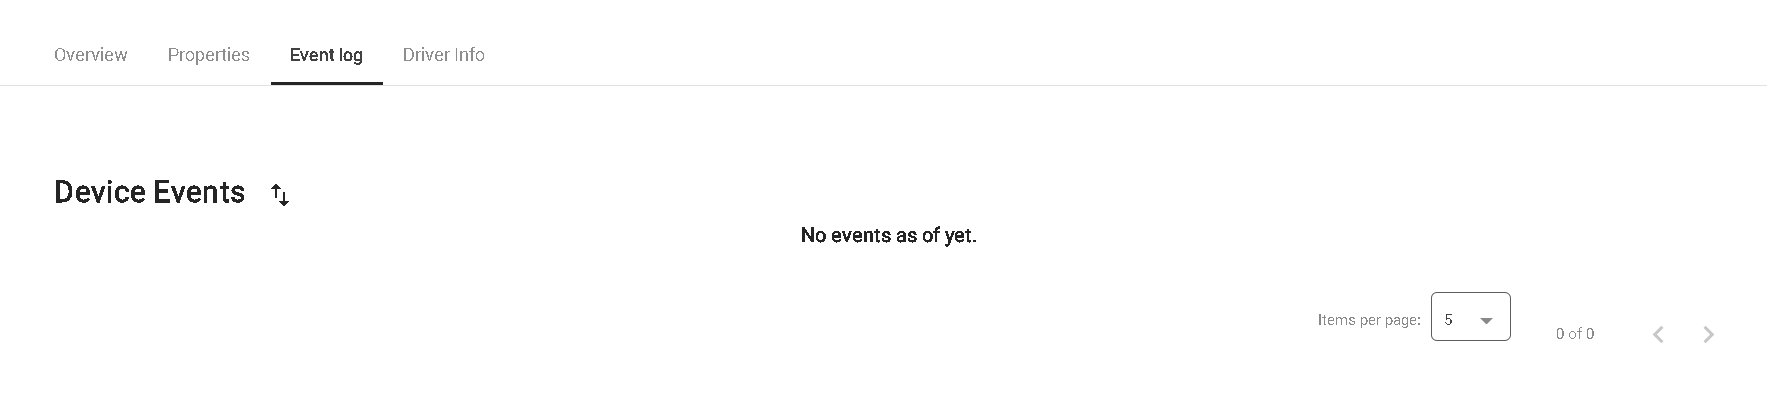
Figure 14 - Gateway Device Event Log
Device Driver Information
The driver information tab will provide the user with information about the driver which supports the device connected to the gateway, which includes but is not limited to:
- Driver name,
- Connection status,
- Driver type,
- Driver version.
In the event that there is no driver deployed for that device, the window will show “No driver info available”.
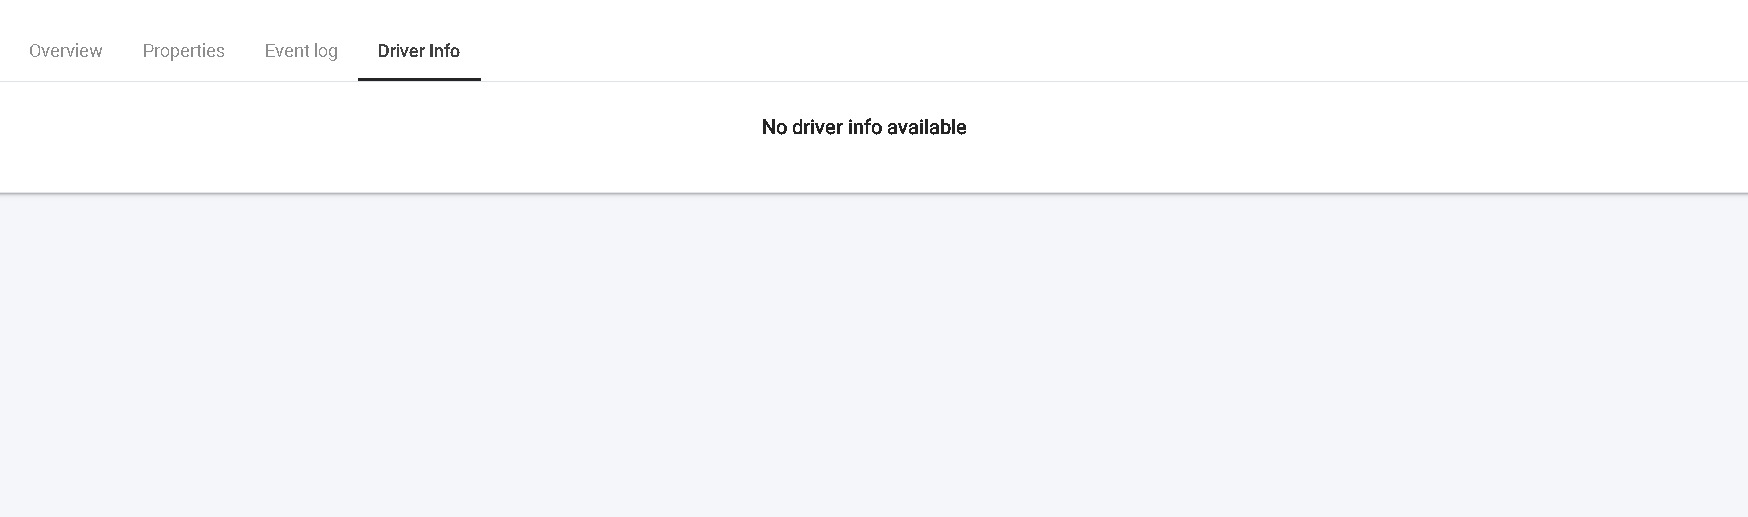
Figure 15 - Gateway Device Driver Information