Kubernetes Setup and Config
Jan 1 2022 at 12:00 AM
- Kubernetes Cluster Setup
- Amazon Web Services
- Microsoft Azure
- VMWare (On Premises)
- Configuring the Kubernetes Cluster
- Kubernetes Monitoring
- Kubernetes Disaster Recovery Process
Kubernetes Cluster Setup
The Kubernetes Cluster consists of servers that can be categorised into manager nodes and worker nodes. Each worker node contains services necessary to run pods/containers and is managed by the manager node(s).
The IoT.nxt® environment is designed for deployment to any native Kubernetes environment. We have already deployed to clusters in AWS, Azure and Alibaba.
Amazon Web Services
In the AWS environment we have several tenant platforms using Elastic Kubernetes Services (EKS). EKS is a hosted Kubernetes environment that is deployed onto underlying EC2 Nodes that are provisioned either manually or by using an Auto Scaler which determines how many EC2 nodes to run.
The biggest restriction on EKS is the pod limit that Amazon applies to nodes, namely:
- Smaller nodes (2 Core & 6 GiB RAM) are restricted to only running 35 pods per node.
- Larger nodes (4 Core & 12 GiB RAM) and bigger are restricted to 58 pods.
When IoT.nxt® teams configure an EKS cluster, we generally set up nodes in at least three different availability zones for redundancy and we try to configure a cluster with a mix of small and large nodes to try to spread the load a little.
Setting up EKS
https://docs.aws.amazon.com/eks/latest/userguide/getting-started.html
https://docs.aws.amazon.com/eks/latest/userguide/create-cluster.html
Microsoft Azure
We have installed various tenant clusters to Azure on both the hosted Azure Kubernetes Services (AKS) environments and using standard VMs. We do however recommend deploying the cluster on AKS as it is easier to manage and support.
AKS environments are deployed onto manages VM’s that are grouped in a single resource group. Separate to the one that houses the AKS service. This means that other resource groups can also be added to the AKS cluster in Azure VM Scale Sets.
Enabling VM scale sets will create a cluster that uses VM scale sets instead of individual virtual machines for the cluster nodes. VM scale sets are required for scenarios including autoscaling and multiple node pools.
It is also recommended when selecting the node size on cluster creation you select a machine type that supports managed disks in case persistent volumes are required.
Unlike EKS there are no pod restrictions on AKS nodes. Up to 110 containers may run on a single node. This usually means the nodes run out of resources before they run out of nodes and as such it is important to select nodes that are big enough.
- For small nodes we recommend DS2_v2
- For larger nodes we recommend DS4_v2
Setting up AKS:
https://docs.microsoft.com/en-us/azure/aks/intro-kubernetes
https://docs.microsoft.com/en-us/azure/aks/kubernetes-walkthrough
https://docs.microsoft.com/en-us/azure/aks/kubernetes-walkthrough-portal
VMWare (On Premises)
Although the IoT.nxt® platform can be deployed onto any native Kubernetes supported cluster, we generally support deploying the cluster onto a VMWare environment within a data centre.
The following infrastructure should be installed as a minimum cluster configuration:
6 x virtual machines
- 3 x master
- 3 x workers
Virtual Machines need 2 hard drives each
- 1 x OS (ubuntu 18.04)
- 1 x Rook-Ceph (persistent volume setup)
IP addresses
- 1 per virtual machine
- 2 for the load balancer (only using 1 currently)
Ubuntu v 18.04
- Ubuntu update
- Static IP address, DNS address
Allow these machines to access the internet for updates then download and install the below list of packages
- Kubernetes v 1.15
- Kubeadm v 1.16
- Kubectl v 1.16
- Calico v3.11
- Metallb load balancer v 0.8.3
- Voyager v12.0.0-rc.1 (latest stable version preferred. It’s currently broken, so using RC of next one instead)
- Rook-Ceph Operator v1.2.2 (latest stable version)
- Rook-Ceph v14.2.6 (latest stable version)
- Rook-Ceph Tools v 1.2.2 (latest stable version)
- Rook-Ceph creates persistent volumes on the Kubernetes cluster, these volumes are being created for the vRaptor installation
- vRaptor v 4
Prometheus
- Prometheus node exporter installation
- Prometheus configuration and setup to monitor
Example of environment
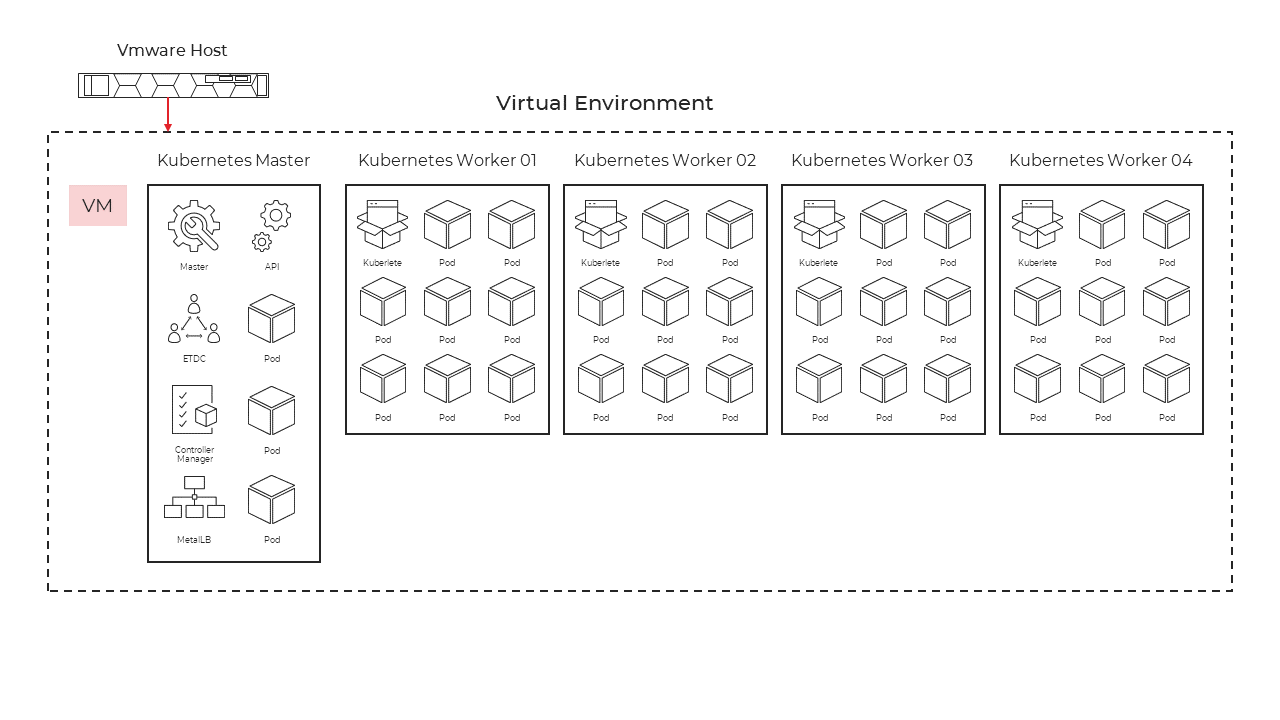
Figure 1 - Kubernetes VMWare deployment overview
The whole infrastructure can be deployed with the help of an ansible playbook script.
The following is an example of an inventory file that will be needed to be able to run the necessary steps on all the virtual machines:
Inventory example:
[k8s_control]
192.168.20.50 hostname=k8s-master01.office

[k8s_worker]
192.168.20.51 hostname=k8s-worker01.office
192.168.20.52 hostname=k8s-worker02.office
192.168.20.53 hostname=k8s-worker03.office
192.168.20.54 hostname=k8s-worker04.office

[kubernetes:vars]
enable_swapfile=False
kubeadm_version=1.16
kubectl_version=1.16
k8s_default_version=1.15
calico_version=v3.11
kubeadm_pod_cidr_range=10.142.0.0/16

Kubernetes
kubeadm_metallb_version=v0.8.3
kubeadm_metallb_ip_ranges='["192.168.20.62-192.168.20.65"]'
helm_primary_version=3
kubeadm_ingress_controllers='["voyager","nginx-ingress"]'
kubeadm_voyager_version=v12.0.0-rc.1
kubeadm_install_rook=true
kubeadm_ecr_access_key_id=<access id here>
kubeadm_ecr_secret_access_key=<secret here>
kubeadm_ecr_region=eu-west-1
kubeadm_ecr_account_id=830156806394

Network Timeserver
ntp_servers=['<TimeIP1>','<TimeIP2>']

[kubernetes:children]
k8s_control
k8s_worker
The inventory file specifies all the needed settings to be changed like hostnames etc., the ansible script does all the needed checks and add secrets as needed.
The yaml file needs the inventory file to be able to do the necessary installation and configuration. This yaml file consist of a few roles:
# Ensure that we have Python
- hosts: all
  roles:
  - bootstrap

# Base setup for all hosts
- hosts: all
  roles:
  - common

- hosts: rabbitmq
  roles:
  - rabbitmq

- hosts: mongodb
  roles:
  - mongodb

- hosts: loadbalancers
  roles:
  - loadbalancer

# Docker swarm config
- hosts:
  - masters
  - workers
  roles:  # each role will exclude irrelevant hosts
  - docker
  - master  # This gets the tokens that the worker role needs
  - worker

# Docker swarm DTR config
- hosts: master
# Primary master, not all of them, note the singular
  roles:
  - registry

- hosts: rancher
  roles:
  - rancher

# Get the tools for RKE deployment on all the load-balancers
- hosts: loadbalancers
  tasks:
  - block:
    - include_role:
        name: helm3
    - include_role:
        name: rke

# Deploy the RKE cluster from the relevant box
# This needs ansible_ssh_common_args='-A' set in, say, the inventory
- hosts: loadbalancers
# The 'when' filters this become: no
# Need to have SSH agent forwarding possible, handled per-task force_handlers: True
  tasks:
  - include_role:
      name: rke_rancher

# Install container runtime for kubeadm cluster
- hosts:
  - k8s_control
  - k8s_worker
  roles:
  - docker-ce
  - kubeadm_cluster
Common role – this role makes sure the operating system is up to date and all the necessary packages are installed to continue with the ansible script.
Kube cluster role – Install and configure all the Kubernetes requirement, install, and configure ingress with the correct ports and IP addresses, install and configure rook-cepf for the persistent storage requirement
Ansible in conjunction with inventory file and the yaml file will setup all the master virtual machines and the worker virtual machines with the same version of software and configuration. This means all the master virtual machines and worker virtual machines are similar with only different IP addresses and different hostnames.
Configuring the Kubernetes Cluster
Once the cluster has been created a KubeConfig file will need to be created for the vsts user that will allow IoT.nxt® to import your cluster into our Rancher environment for monitoring and also to allow the core cluster to be able to deploy updates to this cluster. Since the deployment creates and manages its resources, the vsts user is required to be part of the Cluster Admin RBAC role. Deploying the tenant to this cluster also requires certain setups and prerequisites to be done on the cluster beforehand. These are explained below:
Cluster Admin User
In order for the IoT.nxt® core stack to deploy a Tenant to the cluster, a user will need to be created with Cluster Admin rights which allow the user to be able to Create, Delete and Change services as part of a deployment.
To do this you will need to apply the following yaml file and scripts to setup and the user and get the necessary details which allow access.
Create the Service Account
Save the below script to user.yaml
apiVersion: v1
kind: ServiceAccount
metadata:
  name: <account name>
  namespace: kube-system
Run command line
> Kubbectl apply -f user.yaml
Assign RBAC Role
Save the below script to role.yaml
apiVersion: rbac.authorization.k8s.io/v1beta1
kind: ClusterRoleBinding
metadata:
  name: <account name>
roleRef:
  apiGroup: rbac.authorization.k8s.io
  kind: ClusterRole
  name: cluster-admin
subjects:
  - kind: ServiceAccount
    name: <account name>
    namespace: kube-system
Run command line
> Kubbectl apply -f role.yaml
Get KubeConfig settings
Run the following scrip and use the secret name returned
> kubectl -n kube-system get serviceaccounts **<account name>** -o yaml
apiVersion: v1
kind: ServiceAccount
metadata:
annotations:
kubectl.kubernetes.io/last-applied-configuration: |
{"apiVersion":"v1","kind":"ServiceAccount","metadata":{"annotations":{},"name":"<account name> ","namespace":"kube-system"}}
creationTimestamp: "2019-08-15T07:12:52Z"
name: <account name>
namespace: kube-system
resourceVersion: "5613518"
selfLink: /api/v1/namespaces/kube-system/serviceaccounts/vsts
uid: 18cc4aa6-bf2c-11e9-bb12-02d2c23897dc
secrets:
- name: <Secret Name>
Running the next script will return the Access Token required to set up your Kubeconfig file
> kubectl -n kube-system get secret **<Secret Name>** -o yaml
Install Helm
Kubernetes Cluster (Tiller)
https://devopscube.com/install-configure-helm-kubernetes/
Helm Client
https://helm.sh/docs/intro/install/
Pre-Requisite Services
Using Helm install and configure the following services on the cluster before deploying the tenant
| NAME | CHART | APP VERSION | NAMESPACE |
|---|---|---|---|
| cert-manager | cert-manager-v0.9.1 | v0.9.1 | cert-manager |
| external-dns-commander-io | external-dns-2.12.0 | 0.5.17 | external-dns |
| nginx-ingress | nginx-ingress-1.24.2 | 0.26.1 | nginx-ingress |
Cert-manager
https://hub.helm.sh/charts/jetstack/cert-manager
> helm repo add jetstack https://charts.jetstack.io

> helm install jetstack/cert-manager --version v0.13.0
External-dns-commander-io
https://hub.helm.sh/charts/stable/external-dns
> helm install stable/external-dns --version 2.12.0
Nginx-ingress
https://hub.helm.sh/charts/stable/nginx-ingress/1.24.4
> helm install stable/nginx-ingress --version 1.24.4
Kubernetes Monitoring
The Kubernetes Cluster consists of servers that can be categorized into manager nodes and worker nodes. Each worker node contains services necessary to run pods/containers and is managed by the manager node/s.
Kubernetes Cluster monitoring consist of monitoring the cluster itself and monitoring the pods/services running inside the cluster. As such this environment needs to be closely monitored and there are a couple of metrics to monitor as listed below:
- Node resource utilization i.e. network bandwidth, disk usage, CPU and memory.
- Number of nodes available i.e. the number of nodes deployed vs the number of nodes running.
- Running pods i.e. you can check the number of worker nodes vs the number of pods running and determine the required worker nodes for the cluster.
- Application metrics i.e. the number of errors accumulated over a certain time.
Monitoring can be done using any number of tools. It is up to the technical team doing the monitoring to decide which tool they will use. The IoT.nxt® team uses the following tools for monitoring and alerting:
Prometheus
The Prometheus database is used to collect metrics from any configured Kubernetes Cluster using node-exporter and store the metrics for alerting and monitoring. Prometheus can also be used to report on terminated pods due to OOM, resource requests vs resource limits etc.
EFK stack
The EFK (Elasticsearch, Fluentd, Kibana) stack is used for monitoring the Kubernetes Cluster. This stack plays a pivotal role in collecting and centralising logs from pods and containers. The logs are then sent to the Elasticsearch database. FluentD is a data collector which unifies the data collection and consumption for better usage. It structures data as JSON where possible, but it also has plugin-architecture which is supported by a community. Kibana is the visualisation engine for Elasticsearch data. It has features for time-series analysis, machine learning, graph and location analysis.
With EFK, you can create and run queries to pinpoint specific errors or strings within the logs. Findings are visualized through Kibana. Additionally, Elasticsearch can seamlessly be integrated with Grafana, offering a unified monitoring system. While an EFK stack hosted onsite is cost-free, clients have the option to use cloud-hosted services like AWS for a fee.
Grafana
IoT.nxt® uses Grafana as a consolidated dashboard for our teams to be able to check into what is happening on our Kubernetes Cluster. All our dashboards are customised to suit our needs, but these can be exported and shared with the customer support team if required.
Datadog
Datadog is a solid alternative to Prometheus and Grafana or EFK stack. The upside to this system is that it is the datastore and dashboard in one. It is however not free and is set up as a managed service which means you pay a license fee per agent that you deploy onto any given server. It is, however, easy to establish and get running and because it is a managed service you do not have to carry the cost of hosting the server to be able to run Prometheus and Grafana.
Alerting
Alerting can be set up on all the above-mentioned tools and should be used as an early warning system to identify when something is going wrong or something is simply not running correctly in the cluster. Email alerts can be set up to trigger when certain set thresholds are reached or if there is a problem on the cluster.
Kubernetes Cluster monitoring in detail
There is a comprehensive description of the monitoring capabilities and list of metrics as well as available monitoring tools and relevant metrics to watch and why listed below:
https://coreos.com/operators/prometheus/docs/latest/user-guides/cluster-monitoring.html
Kubernetes Disaster Recovery Process
The Kubernetes Cluster is the containerised environment that hosts and runs the IoT.nxt® solution. It provisions and runs all the different microservices that make up the platform and is responsible for running and keeping all deployed services live, always. This system is designed to run over multiple underlying servers (nodes) and is meant to be fully redundant and highly available. If something happens to one of the nodes or the services running on it then the services are simply moved to a new node and we carry on as before.
Due to the fact that the system can now run in any standard Kubernetes cluster and the Tenant namespace does not need to be in close proximity to the core management namespace we can now run tenants in clusters on different clouds and in different geographic locations. As part of the tenant deployment process we must select the cluster we want to deploy to from a list of available clusters.
Fail Over Plan
In the event of the system experiencing outages due to networks or nodes being down the matter is immediately escalated to the development and DevOps teams as this is a highly technical environment. Generally, clusters are set up with node autoscaling which means the cluster will automatically replace any unhealthy nodes with new healthy ones.
If after the prescribed time the situation has not been rectified and the cluster access has not been re-established in a stable fashion, we will change the cluster the tenant is deployed to and deploy them onto another available cluster.
We will then need to bring the current environment offline by cleaning out all the namespaces, nodes, and existing networks. Once the normal cluster that the tenant runs on has been brought back online and stable, we can simply change the tenant cluster in portal and deploy the tenant back to its original environment.
All our smaller tenants are shared across at least two production clusters to ensure that they are used and running at all times, this means if one is lost we can switch to the second one knowing it is already running and ready as it already has live tenants on it.
Larger, busier tenants are generally run on their own clusters, but these too can be switched to any other cluster as required. The only proviso to this is that the backup cluster must have all the same firewall and resource access as the original cluster.
In the case of on-prem clients it is recommended to have a standby cluster running or available to start up at a moment’s notice if this ever becomes necessary.
It is important to note that no data is lost in this exercise as all data is either in the MongoDB or on the RabbitMQ server waiting to be processed.
Possible time of outage:
- 30 minutes support time
- 15 minutes fail
- 15 minutes of validation and testing
Impact
Obviously, this environment has a high level of impact as everything is run on it. As such we could see a total outage if the system suffers a complete shutdown of nodes or a partial outage under which network routing works only on some calls but not others.
In the second scenario it is important to note that some calls will go through and work fine, and others won’t, what this does is cause inconsistencies with screens, views and API calls. From a screen perspective it is usually fixed by refreshing the screen manually or in the case of any APIs, a queue or reconnect and retry would allow the system to keep working all be it with a performance hit.
As soon as the nodes and network are stabilised, or the tenant is deployed to a secondary cluster the system should start working normally within a few minutes.