The Commander™ Architecture
Jan 1 2022 at 12:00 AM
This section provides an overview of the Commander™ platform architecture and will briefly describe each component.
Introduction
Commander™ is an application enablement platform that enables the visualization and control of telemetry data across the entire platform. The platform’s single-user interface allows your business to input all your proprietary business processes and automate decision-making.
Commander™ is cloud-agnostic and can be hosted in multiple cloud environments and utilises a containerised microservice architecture running on Kubernetes. The Commander™ platform has two deployment models to cater for big and small implementations. A tenant can be deployed per customer with dedicated resources in an isolated environment or an Account can be created on a shared tenant to reduce costs as resources are shared by the different accounts.
Commander™ includes multiple applications and is used to create and link endpoints to edge devices as well as to setup functions, triggers, and alarms based on the endpoints values. From the Account management app users can manage their account and the users’ access. Commander™ also gives you the ability to build your own dashboards so that you can monitor your devices, your way.
Architecture overview
The Commander™ platform consists of five layers illustrated in figure 2 below.
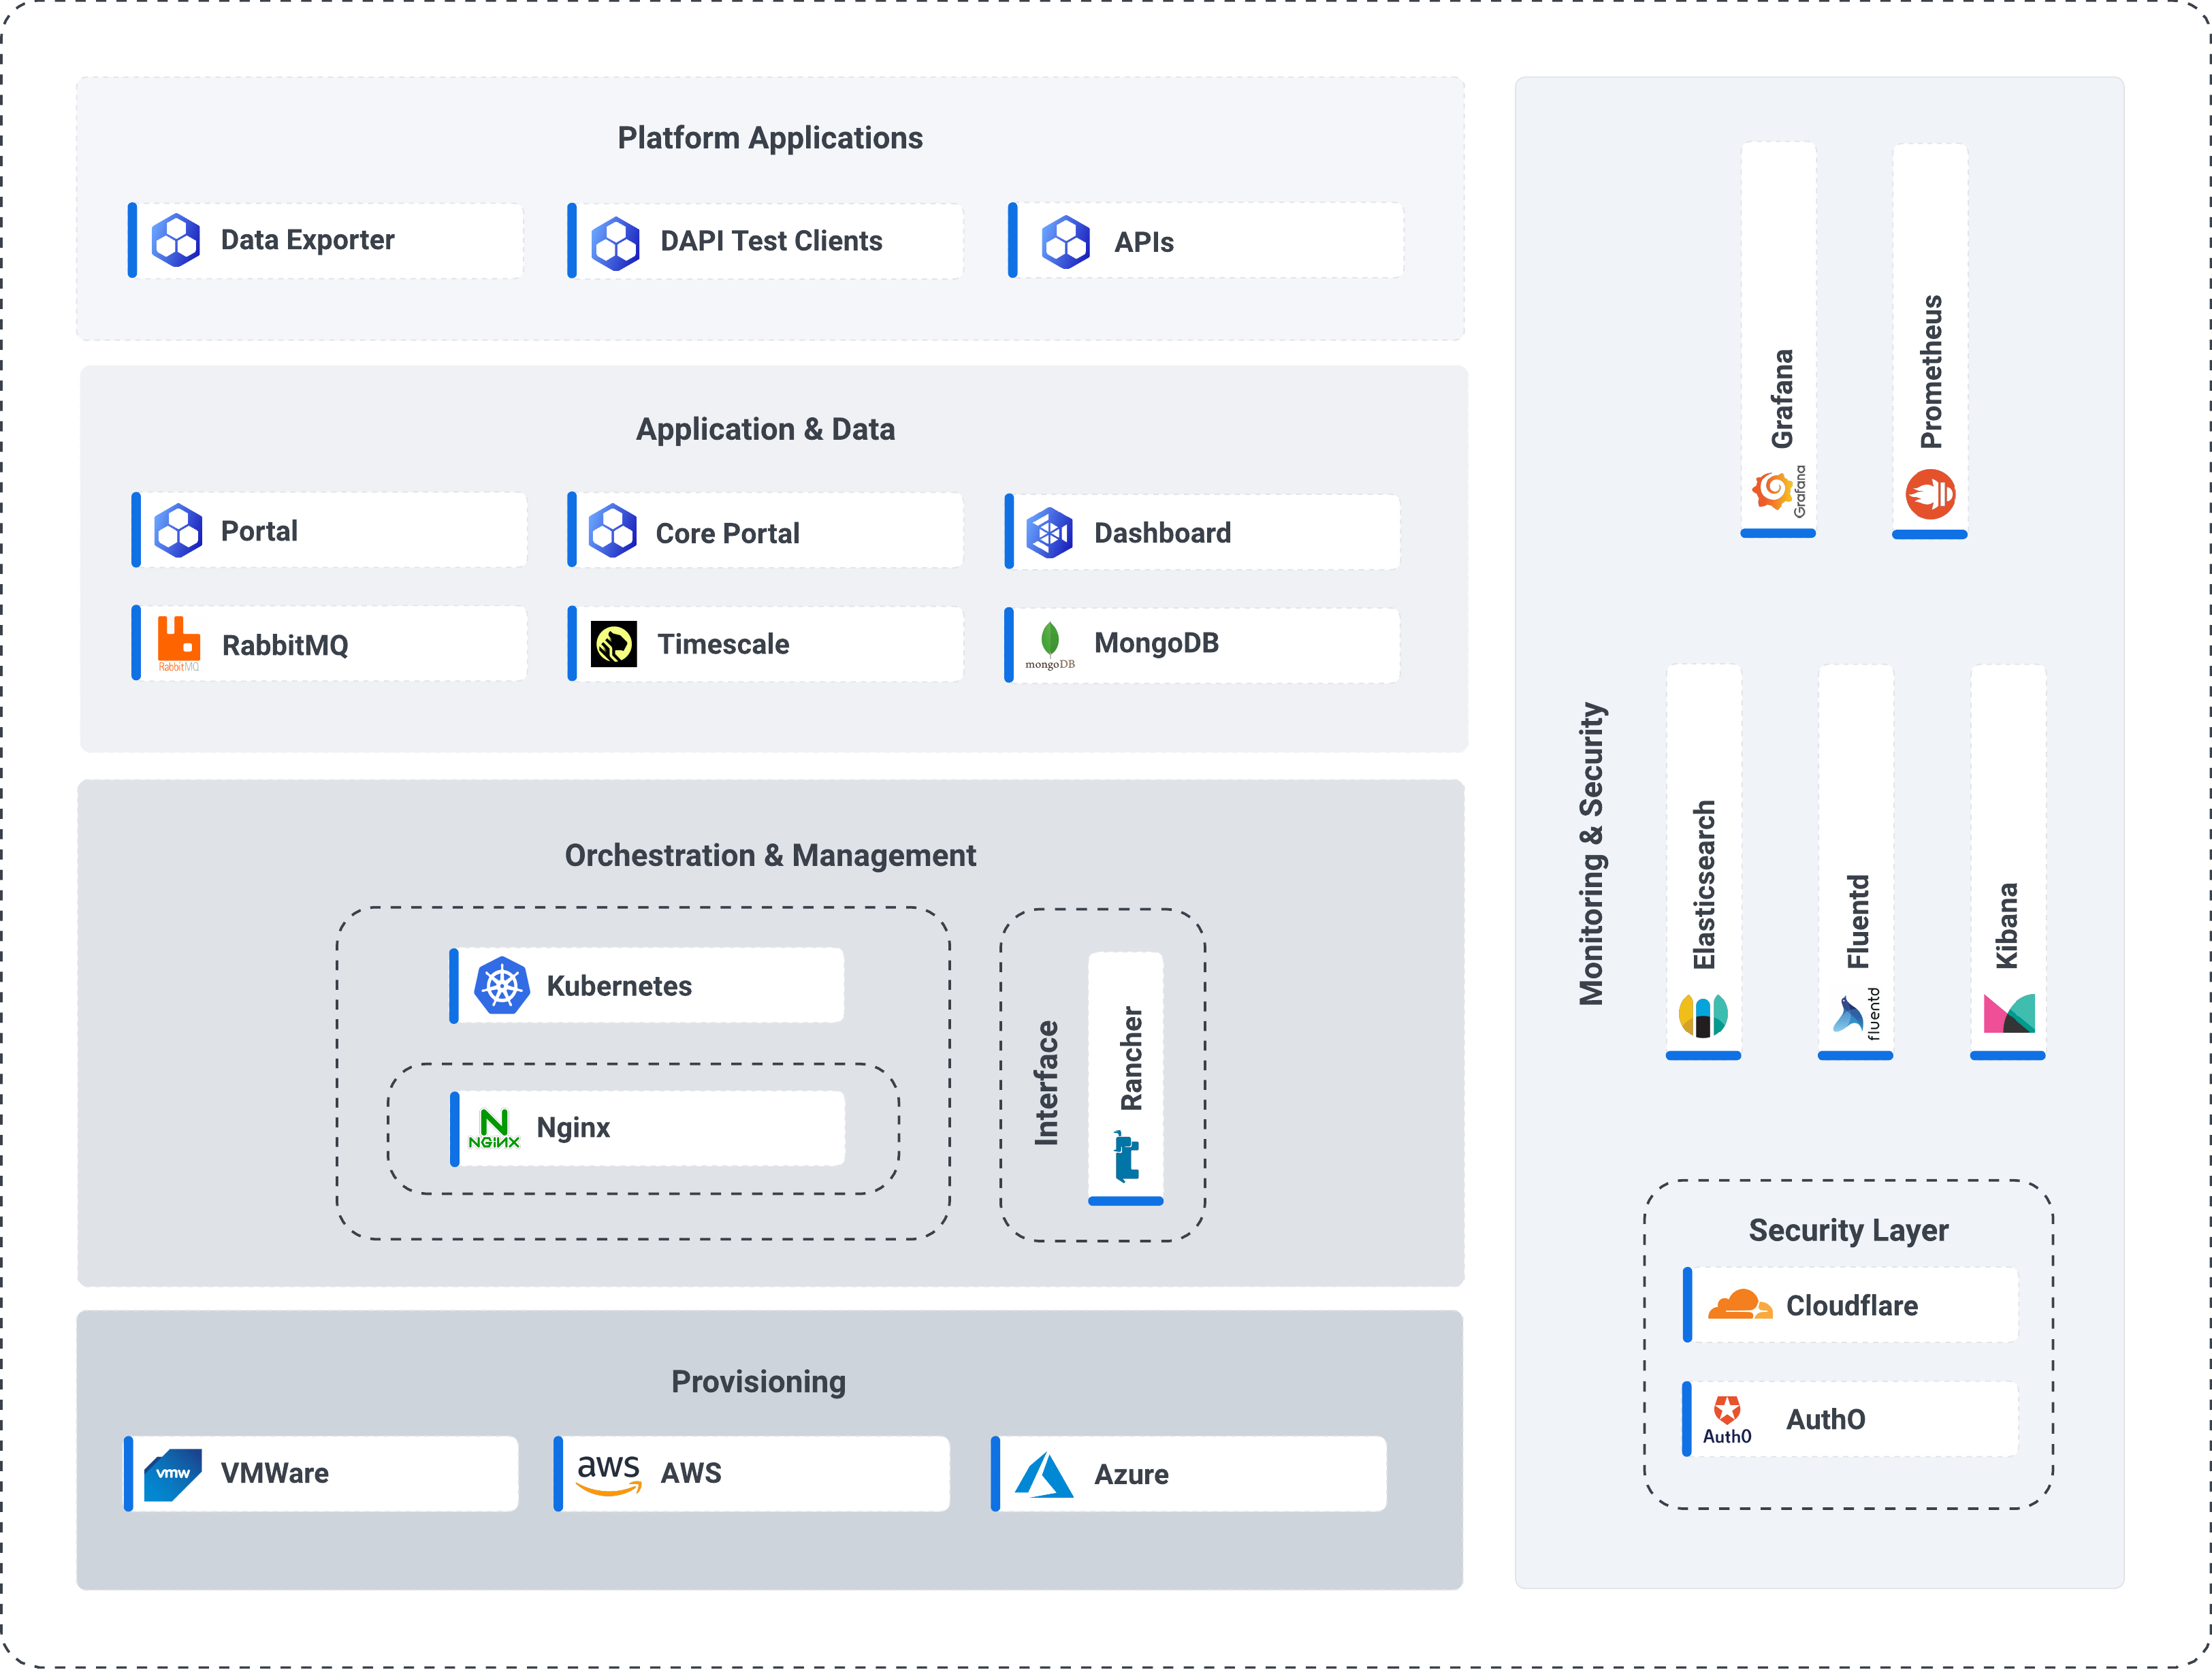
Figure 1 - The Commander™ Architecture
Hardware
This section details the infrastructure required for networking, compute, and storage on which to run the necessary software components. Commander™ is designed to run in the cloud or on-premise when machines with suitable specifications are provisioned.
It is important to note that the Commander™ makes use of storage in most of its services as part of its persistent data storage and messaging system. For more information about this, please consult the Navigator™ documentation.
Server
The Commander™ stack can be run on bare-metal and be hosted in-house. Dedicated servers offer close to metal implementation with little overhead while each server is dedicated privately to one client. The customer receives access to a physical server with the agreed hardware specifications, processing, and storage all in one unit. This allows for loose coupling and there is no need to be constantly connected to our hosted stacks.
Cloud
On dedicated servers and most private servers, the storage disks and the processing power are all on one physical host machine, but with cloud servers the storage backend and the compute nodes are run separately. This provides many advantages such as easy scalability and redundancy through automation, over the traditional virtualisation platforms, while still guaranteeing highly competitive performance and pricing.
Provisioning
VMWare
VMware is used as a way of virtualising our servers to run multiple operating systems over a single physical host computer. Each virtual machine can run a single instance of any operating system (Microsoft, Linux, etc.) simultaneously. This limits the required hardware footprint and allows for much faster provisioning. It also allows for simple resetting and retesting of various environments.
AWS
Amazon Web Services (AWS) is a secure cloud services platform, offering compute power, database storage, content delivery and other functionality to help businesses scale and grow.
Features:
- EC2 (Elastic Compute Cloud) — These are the virtual machines in the cloud on which you have the OS level control. You can run any OS on EC2.
- LightSail — If you do not have any prior experience with AWS this is for you. It automatically deploys and manages compute, storage and networking capabilities required to run your applications.
- ECS (Elastic Container Service) — It is a highly scalable container service enabling you to run Docker containers in the cloud.
- EKS (Elastic Container Service for Kubernetes) — Allows you to use Kubernetes on AWS without installing and managing your own Kubernetes control plane. It is a relatively new service.
- Lambda — AWS's serverless technology that allows you to run functions in the cloud. It's a huge cost saver as you only pay when your functions execute.
- Batch — It enables you to run batch computing workloads of any scale easily and efficiently on AWS using Amazon EC2 and EC2 spot fleet.
- Elastic Beanstalk — Allows automated deployment and provisioning of resources like a highly scalable production website.
Azure
Microsoft Azure is a cloud service platform by Microsoft, which provides services in different domains such as compute, storage, database, networking, developer tools and other functionality which help organisations to scale and grow their businesses.
Azure users choose Virtual Hard Disk (VHD), which is equivalent to a Machine Instance, to create a VM. VHD can be pre-configured by Microsoft, the user or a third party. The user must specify the number of cores and the amount of memory while Azure offers temporary storage through D drive and block storage through Page Blobs, for VMs. Block Blobs and Files also serve as object storage. It supports relational databases, NoSQL and Big Data through Azure Table and HDInsight. Azure also offers site recovery, Import-Export and Azure Backup for additional archiving and recovery options. Microsoft offers Virtual Network (VNET) that offers users the ability to create isolated networks as well as subnets, route tables, private IP address ranges and network gateways. Both companies offer solutions to extend the on-premise data centre into the cloud and firewall option.
Microsoft also has a strong track record for meeting new demand and offers Hadoop support with Azure HDInsight. Windows Server 2016 provides integration with Docker for both Windows containers and Hyper-V containers. The platform can run both Windows or Linux containers.
Orchestration and Management
Kubernetes
Kubernetes has become the de facto standard in distributed service orchestration. Kubernetes provides several advantages over a similar orchestration technology such as Docker Swarm. Some of the advantages we utilise:
- Clear logging
- Excels at distributed service orchestration and scaling
- Fail-over management
- Large support community
- Feature-rich (multiple resource types, extensible, configurable)
Kubernetes has been battle-tested and is actively supported.
Nginx
This technology is commonly used to serve website files and to act as a proxy. Because it can handle a high volume of connections, NGINX is commonly used as a reverse proxy and load balancer to manage incoming traffic and distribute it to slower upstream servers – anything from legacy database servers to microservices. It is fast and supports thousands of concurrent connections.
Ambassador Edge Stack
Ambassador Edge Stack is a full Kubernetes-native ingress controller, load balancer, and API Gateway built on Envoy Proxy.
Key features in Ambassador Edge Stack include:
- L7 traffic management: support for multiple forms of load balancing, automatic retries, circuit breaking, timeouts, and more
- Support for gRPC, TCP, HTTP/1, HTTP/2, gRPC-Web, and WebSockets
- Observability, with support for distributed tracing, monitoring, and logging
- Security, with OAuth/OpenID Connect, TLS, automated certificate management with ACME support, and service mesh integration
The Ambassador Edge Stack will eventually replace Nginx as the only reverse proxy utilised by Commander™.
Service Mesh
Service Mesh manages the network traffic between services. It does that in a much more graceful and scalable way compared to what would otherwise require a lot of manual, error-prone work and operational burden that is not sustainable in the long-run.
In general, service mesh layers on top of your Kubernetes infrastructure and is making communications between services over the network safe and reliable.
Service mesh allows you to separate the business logic of the application from observability, as well as network and security policies. It allows you to connect, secure, and monitor your microservices.
- Connect : Service Mesh enables services to discover and talk to each other. It enables intelligent routing to control the flow of traffic and API calls between services/endpoints. These also enable advanced deployment strategies such as blue/green, canaries or rolling upgrades, and more.
- Secure : Service Mesh allows for secure communication between services. It can enforce policies to allow or deny communication. E.g. you can configure a policy to deny access to production services from a client service running in a development environment.
- Monitor : Service Mesh enables observability of your distributed microservices system. Service Mesh often integrates out-of-the-box with monitoring and tracking tools (such as Prometheus in the case of Kubernetes) to allow you to discover and visualize dependencies between services, traffic flow, API latencies, and tracing.
These key capabilities provide operational control and observability into the behaviour of the entire network of distributed microservices that make up a complex cloud-native application.
Service Mesh is critical when you are dealing with web-scale or hyper-scale microservices workloads (Netflix, Amazon, etc.)
Helm
Helm as a templating engine for Kubernetes deployments, gives us the flexibility to easily alter multiple Kubernetes resources at the same time from a single location.
- Singular place of configuration.
- Can provide a complete installation of all resources needed to run an application (collectively known as a chart).
- Can combine multiple charts into one chart (called an umbrella chart).
- Charts can be versioned.
Application and Data
MongoDB Server
MongoDB as a document database allows for easy altering of database schemas and supports adaptive models such as inheritance, for example. It also has the following advantages:
- Document oriented.
- High performance (100k writes/s; 200k reads/s with a single node).
- High availability — Replication.
- High scalability – Sharding.
- Dynamic — No rigid schema.
Our system requires high write speeds for the saving of telemetry and endpoint values along with high read rates when processing/reporting data. Data captured by the Commander is stored in MongoDB databases. Each tenant has its own MongoDB database instance while all database instances require authentication. The built-in data encryption-at-rest feature provided by MongoDB is not enabled, as encryption of data at rest is provided by the data storage provider.
RabbitMQ Server
A message broker acts as an intermediary platform when it comes to processing communication between two applications. RabbitMQ is one such open-source enterprise messaging system modelled on the Advanced Message Queuing Protocol (AMQP) standard.
Message brokers do many things such as:
- Decouple message publisher and consumer.
- Store the messages.
- Routing of messages.
- Monitoring and management of messages.
RabbitMQ has several advantages:
- Reliability : RabbitMQ offers a variety of features to let you trade off performance with reliability, including persistence, delivery acknowledgements, publisher confirms, and high availability.
- Flexible Routing : Messages are routed through exchanges before arriving at queues. RabbitMQ features several built-in exchange types for typical routing logic
- Clustering : Several RabbitMQ servers on a local network can be clustered together, forming a single logical broker.
- Highly Available Queues : Queues can be mirrored across several machines in a cluster, ensuring that even in the event of hardware failure your messages are safe.
- Multi-protocol : RabbitMQ supports messaging over a variety of messaging protocols.
- Many Clients : There are RabbitMQ clients for almost any language you can think of.
- Management UI : RabbitMQ ships with an easy-to-use management UI that allows you to monitor and control every aspect of your message broker.
- Tracing: If your messaging system is misbehaving, RabbitMQ offers tracing support to let you find out what's going on.
Red Green Queue
Our microservices communicate between each other via the Red Green Queue.
Green Queue
- Public RabbitMQ interface using a public username and password.
- Devices connect using a 3-way handshake and use the public key of the green queue.
- The Public key is used to encrypt the session key; the session key is used to encrypt the data payload.
- Connects to the Master Broker
- Validates the request and tenant the originator belongs to.
- Customer ID is used as a partition, creates credentials for the caller to connect to Tenant RabbitMQ.
- Credentials and DNS (RabbitMQ) are returned for the caller to connect to.
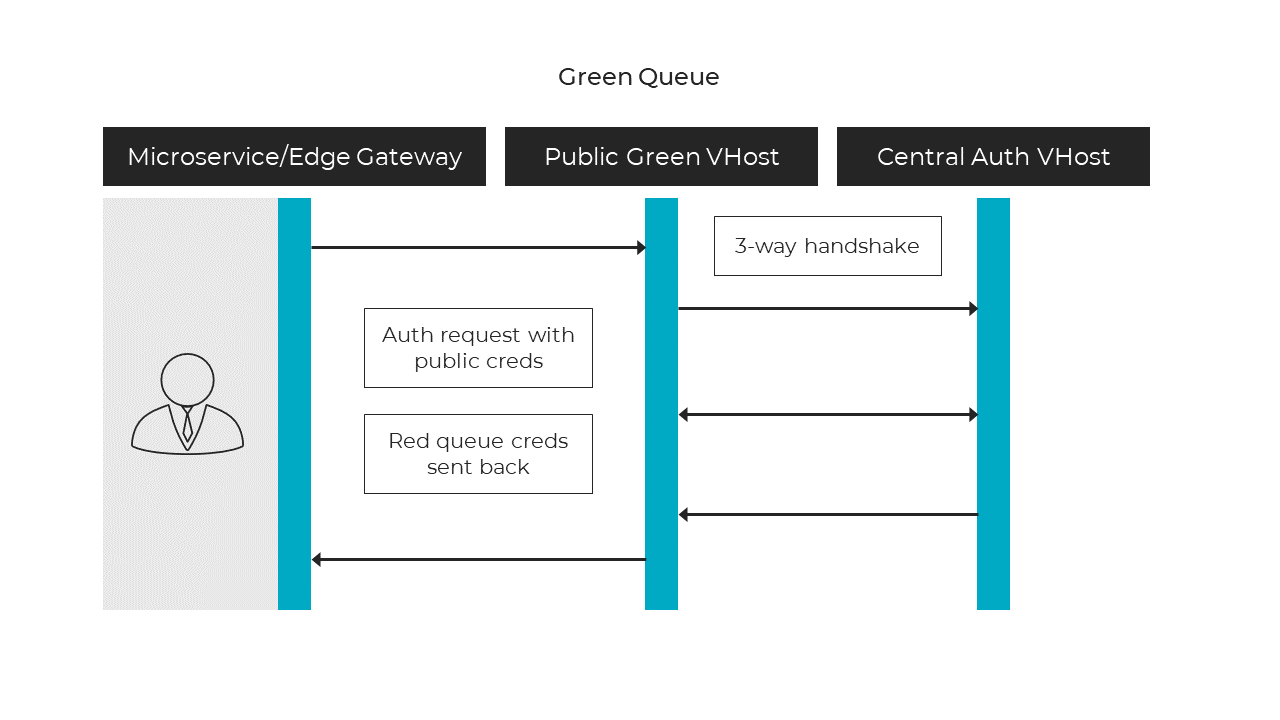
Figure 2 - Green Queue
Red Queue
- Once the caller connects to the Green queue and is given credentials, it can then connect to the Red queue.
- Customer specific virtual host.
- Telemetry can then be sent to a customer specific IoT Hub.
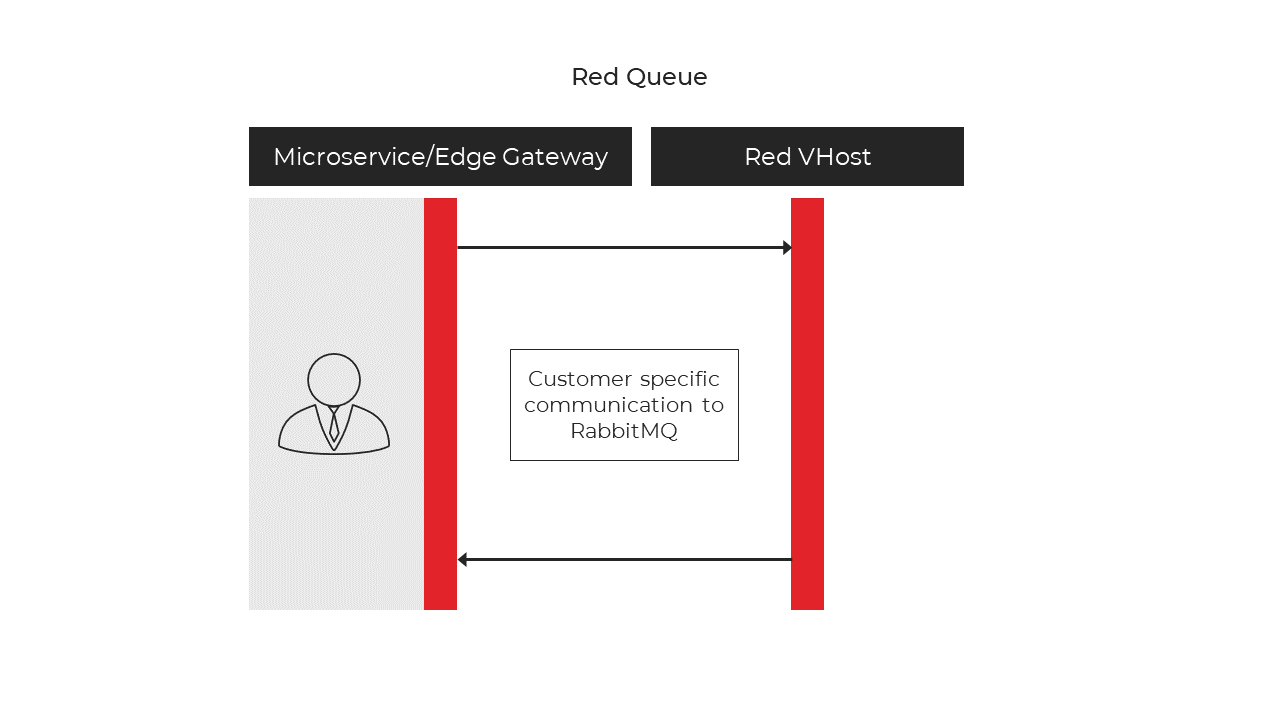
Figure 3 - Red Queue
Portal
The portal is a central point of configuration for a tenant and is a supporting application for dashboard. The portal allows for:
- Building and configuring of entities and gateways.
- Building and configuring of supportive cloud services (e.g. SMS sending, emails).
- User authentication control.
The portal was built to keep the dashboard clean and separate from the administrative component behind dashboard.
The portal is used to create the link between the edge devices and Commander™. The portal is based on entities and the relation of entities. Endpoints, functions, triggers, alarms etc. are all entities that can be grouped into Sites or Entity groups.
Endpoints are entities that represent values within the Commander™. Static endpoints represent static values that are not based on values received from an edge device. Normal endpoints are entities linked to a specific property of an edge device.
Functions can be created to perform complex calculations based upon entity values. Available functions that can be used include mathematical functions (sum, average, count, etc.), location-based functions (calculate a GPS location, distance between two points, etc.) and time-based functions (Time between, current time, etc).
Triggers can be setup to perform actions based upon a specified condition. A trigger can activate or deactivate alarms, send notifications to users, and update endpoint values.
For more information on the methods available in functions, please see the following document: link : IoT.nxt Commander Portal Functions
Scheduling is done by setting up calendars within Portal. The calendars can be viewed and edited in dashboard. The scheduler can be setup to send calendar events to Raptor&trade, this will enable Raptor™ to execute actions based upon these events.
Blueprints are a collection of properties. An entity group can be tagged with a blueprint and will adhere to the blueprint if the group contains entities that matches all the properties of the blueprint.
A Digital Twin is a concept that enable users to build a Digital Twin template of a device, object, or a site (batteries, generator, cell phone towers, etc) and then create multiple instances of the same Digital twin. The Digital Twin template can consist of any of the current entity types that includes Commander™ views and can be nested to build complex models. A Digital Twin template can further be edited and rolled out with the new changes to all existing instances or to specific instances depending on the user requirements.
For more information on the widgets available in Commander™ dashboard, please see the Digital Twin documentation.
TEST.
Core manager Portal
A core Portal deployment enables IoT.nxt® to manage all client tenants. Ad hoc services can be configured on the Core Portal and deployed to the client's tenant. All billing data and license agreements are collected on the client's tenant and send to the Core Portal.
Dashboard
Commander™ dashboard is the visualization of entity values; various widgets can be added to a Commander™ view to display the values to the user.
The dashboard has a grid-based layout which is completely configurable. This allows for widgets to be added and resized to give the ability to design and create a dashboard without any technical requirements.
Widgets range from simple single value widget that display a single entity's value, to more complex widgets such as the data grid widget that displays a list of values based upon a blueprint or Digital Twin instances. Endpoint values can also be updated from Commander™by using the gateway communication widget.
For more information on the widgets available in Commander™ dashboard, please see the IoT.nxt® Commander™ Dashboard Widgets documentation.
Integration and Tools
DAPI
DAPI provides a way for API terminators (such as SignalR) to send user requests to microservices in a transparent way. It leverages RabbitMQ and topic exchanges to dispatch packets to routing keys where microservices can pick up and respond to traffic.
DAPI sets forth standards for a set of capabilities that all microservices and API terminates should implement to partake in a distributed, standardised API.
DAPI works on routing keys which are "addresses" that Rabbit exchange uses to decide how to route the message. A message goes to the queue(s) with the binding key that exactly matches the routing key of the message.
SignalR
SignalR is a library for ASP.NET developers to add real-time web functionality to their applications. Real-time web functionality is the ability to have server-side code push content to the connected clients instantly as it becomes available, rather than having the server wait for a client to request new data.
SignalR takes advantage of WebSocket, an HTML5 API that enables bi-directional communication between the browser and server
We use SignalR to subscribe to change events in the system. This allows real time changes to be pushed down to the relevant subscribers by means of Rabbit exchanges.
APIs
The Commander™ stack consists of numerous services, each exposing an API exposing a set of routines, protocols, and tools for building applications or services. Our API's are mostly DAPI API's which are consumed over RabbitMQ. We are in the process of converting most of the API's to standard Web API's.
Telemetry Streaming
This Apache Kafka telemetry streaming service streams live telemetry data from the Commander™ platform into an external Kafka endpoint based on the entities marked for streaming.
Telemetry streamed by this service includes:
- Near real-time endpoint telemetry
- Raised alarms
- Deactivated alarms
This service also maintains a list of all entities in the account that has been marked for streaming. If an entity has been marked for streaming, all its children (all the way down the tree) will be streamed.
Note: Only some entity types can be marked for streaming, these types are:
- Group(s)
- Site(s)
- Calendar(s)
Data Exporters
It is possible to export data captured in a tenant's MongoDB instance using a data exporter. The data exporter allows for the exporting of telemetry from the Commander™ platform to a client's database or server, which could be used for data warehousing, analytics, Machine Learning services, or other 3rd party integrations.
Blueprints are used to identify the entities for which telemetry should be exported. The data exporter also supports exporting alarm history to a destination database.
Currently, the following destination databases are supported:
- Microsoft SQL Server – Both SQL Server 2008 and Azure SQL is supported
- MySql – Any database that supports the MySql syntax is also supported
- MongoDB
- Google BigQuery
The following message queues are supported:
- Apache Kafka – Data is exported in the JSON format
Webhooks
Webhooks enable events to be sent from the Commander™ platform to external systems through the means of a webhook.
A webhook is a method of augmenting or altering the behaviour of a web page or web application with user defined HTTP endpoints that are triggered by an event. This delivers data to other applications as it happens.
Webooks include the following functionality:
- Single event or batch webhooks
- Default and basic retry with exponential back-off functionality within the defined thresholds
- Basic statistics and reporting
- Custom batch sizing
- Simple placeholder(s) mapping to properties will be supported and custom selection of data properties
- Basic, Bearer, Api Token and oAuth 2.0 authentication
- Custom static content types will be supported. Default will be JSON
- Custom static headers and query parameters
Note: Only HTTP Posts to a URL are supported and only some entity types can be marked for webhooks, these types are:
- Group(s)
- Site(s)
For more information, please refer to Feature Page.
Security and Compliance
Each of the layers discussed contain specific security features and each of the security features are discussed in the following subsections.
OAuth
OAuth is an open-standard authorisation protocol or framework that describes how unrelated servers and services can safely allow authenticated access to their assets without actually sharing the initial, related, single logn credential. In authentication parlance, this is known as secure, third-party, user-agent, delegated authorization.
OAuth does not share password data but instead uses authorisation tokens to prove an identity between consumers and service providers. OAuth is an authentication protocol that allows you to approve one application interacting with another on your behalf without giving away your password.
Hardware
The hardware layer is concerned with the platform on which the solution is executed. Two options are currently provided, namely cloud and physical server deployments.
Cloud
The Commander™provided by IoT.nxt® as a service is hosted in AWS. The AWS data centres offer numerous security controls. A full list of available controls is available at https://aws.amazon.com/compliance/data-center/controls/.
Server
The Commander™ platform can also be hosted by a client on a physical server. It is recommended to host the server in an access-controlled environment. Firewalls, intrusion detection systems, and security information and event management (SIEM) services are the responsibility of the client.
Provisioning
VMWare
The Commander™can be run on VMWare ESXi. It is assumed that the VMWare ESXi solution has been hardened (and all the latest security patches were applied) before the Commander™ was installed. The CIS VMWare ESXi benchmark can be consulted for hardening recommendations.
AWS
The AWS virtual private cloud (VPC) network environment provides logical network isolation from other tenants within the AWS environment. Furthermore, restrictive network security groups are used to control access to services exposed within AWS.
Azure
The Azure Virtual Network (VNet) is used in to provide logical network isolation from other tenants within the Azure environment. Restrictive Azure network security groups (NSG) are used to control access to services exposed in Azure.
Orchestration & Management
Kubernetes
The Commander™ and V-Raptor™ solutions utilise a microservice architecture. Kubernetes is used to orchestrate microservice containers. Microservices running within containers receive private IPs and are not directly accessible from the Internet (only accessible via an ingress controller).
Nginx
Nginx is configured to act as a reverse-proxy for the Commander™ web interface. The Nginx reverse proxy is accessible via Cloudflare. The Kubernetes containers hosting the Commander™ are not directly accessible from the Internet and web services provided can only be accessed via the reverse-proxy.
Ambassador Edge Stack
The Ambassador Edge stack is used to authenticate ingress requests for Commander™. This includes validating that an active and valid token is included in the request. The Ambassador Edge stack can also be used to apply ip allow or deny rules and rate limiting.
Helm
Helm is used to manage Kubernetes applications. Helm v2 is currently used. It has been decided internally to replace Helm v2 with Helm v3 due to the security benefits provided by the latter. The Helm v3 integration is a work-in-progress.
Rancher
Rancher is used by the team at IoT.nxt® to manage our Kubernetes instances. Mandatory multi-factor authentication is enforced for all employees and a policy of least privilege is applied.
Cloudflare
Cloudflare acts as a certificate authority (CA), DNS provider, and provides distributed denial-of-service (DDOS) mitigation services.
Monitoring
Our metrics framework is an in-house metrics monitoring solution aimed at logging important data of our services, such as messages processed, processing time, etc.
Prometheus
The service data collected by our metrics framework is then sent to Prometheus, a third-party data aggregation service that collects and transforms the data into something understandable. From here you can query the data and see basic graphs of it.
Prometheus has been configured to support basic authentication. For on-site deployments it is recommended to install SSL/TLS certificates for Prometheus to safeguard the authentication information provided by users.
Grafana
Grafana is an open source data analytics and visualisation tool used to create useful dashboards from the data aggregated by Prometheus. Grafana can also be set up to show alerts on specific criteria, like if a service is receiving more traffic than usual, or processing messages slower than usual. Grafana connects with every possible data source (databases) such as Prometheus, Influx DB, ElasticSearch, MySQL, and PostgreSQL.
*EFK**
EFK (Elasticsearch, Fluentd, Kibana) allows diverse use cases to enable better logging and customisable dashboards. We currently use EFK to monitor logs from our docker containers within Kubernetes. This is client-dependent, however. Clients could choose to use ELK (Elasticsearch and Kibana) instead.
Security practises
Operating system
All virtual machines deployed by IoT.nxt® will utilise Ubuntu LTS releases. Security updates will automatically be applied if access can be obtained to update sites. The Ubuntu installations performed by IoT.nxt® will not contain a bootloader password. For on-site deployment, the client has the option to add a bootloader password, provided that the client takes responsibility of the management and maintenance associated with a bootloader password.
Backup and restore procedures for on-site installations
The client assumes responsibility of all on-site installations. The client therefore also has the responsibility to define proper disaster recovery plans. The disaster recovery plans should also be executed to that the plans in place are effective.
HTTP OPTIONS on port 15672
The RabbitMQ management interface (on port 15672) exposes a REST API. The API utilises the HTTP OPTIONS method is used to describe communications options applicable to the REST API. Disabling HTTP OPTIONS therefore not recommended as it is used for legitimate purposes.
SIEM integration
Log files generated by the VMs and containers used by in the Commander™ can be sent to any log endpoint supported by FluentD (such as Splunk). It is important to realise that log files in a shared environment cannot be shared with external parties (due to potential security and privacy concerns). For this reason, the export of all log files is allowed for clients with Commander™ instances running in their own AWS instances or Commander™ instances running on-site.
Prometheus basic authentication
Prometheus is used for monitoring purposes. The use of Prometheus in the client's AWS instance or on-site deployments is optional. Basic authentication is configured for Prometheus. It is recommended that the client enable TLS protection for Prometheus. Proper network restrictions should also be in place to ensure that only administrators are allowed access to Prometheus.